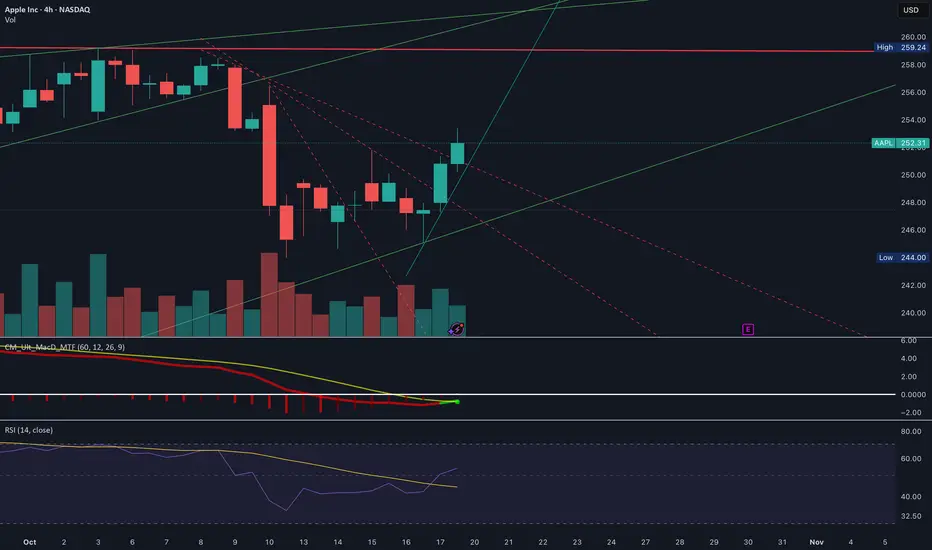
On the 4-hour chart, Apple began a noticeable downward trend around October 8. That trend appears to have shifted around October 16, when the stock hit a low of $245. Since then, it has rebounded to approximately $252.
The strength of this bounce suggests the possibility of continued upward momentum in the short term, potentially lasting through the week leading up to earnings on October 30. Traders may want to watch for support near $245–$248 and resistance near $255–$257, which could indicate the next potential price moves.
The strength of this bounce suggests the possibility of continued upward momentum in the short term, potentially lasting through the week leading up to earnings on October 30. Traders may want to watch for support near $245–$248 and resistance near $255–$257, which could indicate the next potential price moves.
Declinazione di responsabilità
Le informazioni e le pubblicazioni non sono intese come, e non costituiscono, consulenza o raccomandazioni finanziarie, di investimento, di trading o di altro tipo fornite o approvate da TradingView. Per ulteriori informazioni, consultare i Termini di utilizzo.
Declinazione di responsabilità
Le informazioni e le pubblicazioni non sono intese come, e non costituiscono, consulenza o raccomandazioni finanziarie, di investimento, di trading o di altro tipo fornite o approvate da TradingView. Per ulteriori informazioni, consultare i Termini di utilizzo.