Intraday Technical Outlook (15m Chart)
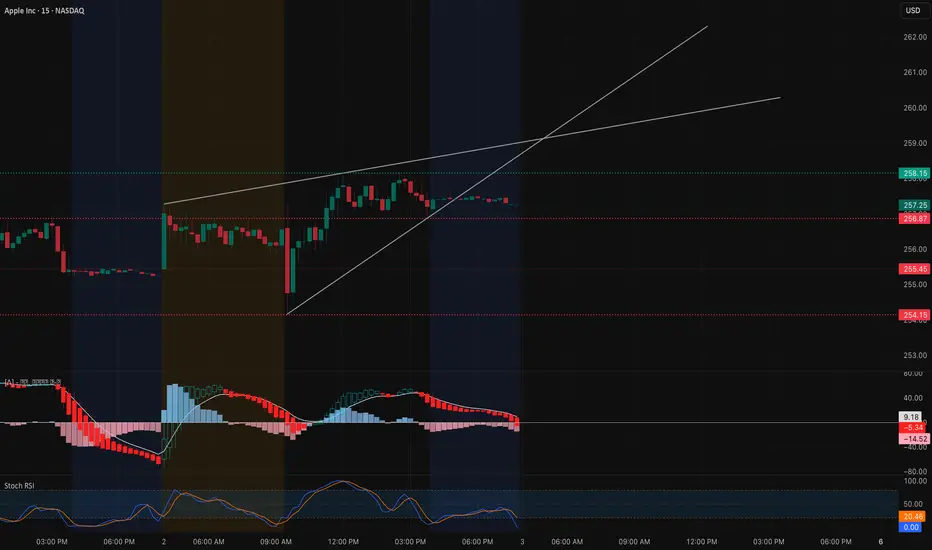
Apple (AAPL) is currently trading near $256.7, consolidating inside a rising wedge formation. The short-term trendline support is being tested, while momentum indicators show early weakness:
* MACD: Bearish crossover with histogram fading, suggesting potential downside pressure.
* Stoch RSI: Cooling off from overbought levels, hinting at reduced buying momentum.
* Key Levels: Immediate intraday support sits near $257–256.5, with stronger downside zones at $255.5 and $254.2 if wedge support breaks. Resistance remains at $259.2–260.0, aligned with the upper wedge line.
Intraday takeaway: Price action is in a tightening range — a breakdown below $256.5 could invite fast downside scalps, while a bounce back above $259.2 opens room for a squeeze toward $260+.
Options Sentiment & GEX Outlook (1H Chart)

The 1-hour GEX map is showing well-defined institutional positioning:
* Gamma Walls:
* $260–262.5: Heavy call wall cluster, aligning as a gamma resistance zone.
* $257.5: Highest positive GEX level, acting as a magnet and resistance pivot.
* $252.5–250: Key put walls, serving as gamma support.
* Implications:
* If AAPL holds above $257.5, momentum traders could target the $260–262.5 gamma wall for short-dated calls.
* Failure to sustain above $257.5 risks a fade toward the $255–252 zone, favoring put spreads.
* Volatility Context: IVR sits around 19.7 (below average), which means option premiums are relatively cheap. This favors directional plays, but be mindful of quick moves as AAPL sits near a gamma pivot.
My Thoughts & Recommendation
For Oct 3 trading, I see AAPL in a make-or-break setup:
* Intraday (scalping/trading): Watch for a wedge break. A clean move below $256.5 favors a test of $255–254. On the upside, reclaiming $259.2 can accelerate momentum toward $260–262.5.
* Options trading (swing/0DTE): Calls make sense only above $257.5, aiming for the $260–262.5 wall. Otherwise, puts are more favorable if price rejects from $257.5 and drifts back into the $255 zone.
Overall bias: Neutral-to-bearish intraday unless $259+ is reclaimed.
Disclaimer: This analysis is for educational purposes only and does not constitute financial advice. Always conduct your own research and manage risk before trading.
Apple (AAPL) is currently trading near $256.7, consolidating inside a rising wedge formation. The short-term trendline support is being tested, while momentum indicators show early weakness:
* MACD: Bearish crossover with histogram fading, suggesting potential downside pressure.
* Stoch RSI: Cooling off from overbought levels, hinting at reduced buying momentum.
* Key Levels: Immediate intraday support sits near $257–256.5, with stronger downside zones at $255.5 and $254.2 if wedge support breaks. Resistance remains at $259.2–260.0, aligned with the upper wedge line.
Intraday takeaway: Price action is in a tightening range — a breakdown below $256.5 could invite fast downside scalps, while a bounce back above $259.2 opens room for a squeeze toward $260+.
Options Sentiment & GEX Outlook (1H Chart)
The 1-hour GEX map is showing well-defined institutional positioning:
* Gamma Walls:
* $260–262.5: Heavy call wall cluster, aligning as a gamma resistance zone.
* $257.5: Highest positive GEX level, acting as a magnet and resistance pivot.
* $252.5–250: Key put walls, serving as gamma support.
* Implications:
* If AAPL holds above $257.5, momentum traders could target the $260–262.5 gamma wall for short-dated calls.
* Failure to sustain above $257.5 risks a fade toward the $255–252 zone, favoring put spreads.
* Volatility Context: IVR sits around 19.7 (below average), which means option premiums are relatively cheap. This favors directional plays, but be mindful of quick moves as AAPL sits near a gamma pivot.
My Thoughts & Recommendation
For Oct 3 trading, I see AAPL in a make-or-break setup:
* Intraday (scalping/trading): Watch for a wedge break. A clean move below $256.5 favors a test of $255–254. On the upside, reclaiming $259.2 can accelerate momentum toward $260–262.5.
* Options trading (swing/0DTE): Calls make sense only above $257.5, aiming for the $260–262.5 wall. Otherwise, puts are more favorable if price rejects from $257.5 and drifts back into the $255 zone.
Overall bias: Neutral-to-bearish intraday unless $259+ is reclaimed.
Disclaimer: This analysis is for educational purposes only and does not constitute financial advice. Always conduct your own research and manage risk before trading.
Declinazione di responsabilità
Le informazioni e le pubblicazioni non sono intese come, e non costituiscono, consulenza o raccomandazioni finanziarie, di investimento, di trading o di altro tipo fornite o approvate da TradingView. Per ulteriori informazioni, consultare i Termini di utilizzo.
Declinazione di responsabilità
Le informazioni e le pubblicazioni non sono intese come, e non costituiscono, consulenza o raccomandazioni finanziarie, di investimento, di trading o di altro tipo fornite o approvate da TradingView. Per ulteriori informazioni, consultare i Termini di utilizzo.