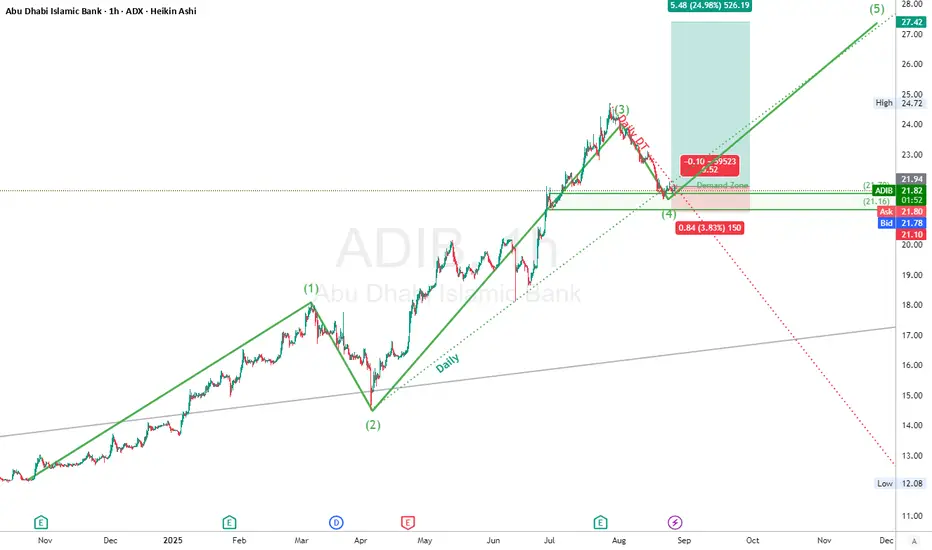
ADIB is showing textbook Elliott Wave behavior. After a strong impulsive wave structure into wave (3), price corrected cleanly into the **Demand Zone** and held above the key support at **21.16** – right in line with a classic wave (4) retracement.
The drop into this zone followed a **bullish descending channel (bullish DT)**, indicating exhaustion of sellers and potential reaccumulation. Price is now rebounding from this base, suggesting wave (5) may just be starting.
A beautiful confluence of:
* Fib levels,
* Demand zone,
* Channel breakout,
* Wave (4) support.
The bulls are stepping in. This is **prime positioning**.
### 🟩 **Demand Zone**
* Key Zone: **21.10–21.78 AED**
* Clean support on both price structure and psychology; price wicked into zone but rejected downside.
### 🎯 **Trade Idea**
* **Entry**: 21.70–21.80 AED (current levels)
* **Stop Loss**: 21.10 AED (beneath structure low)
* **Take Profit**: 27.42 AED (projected wave (5) target)
* **Risk/Reward**: \~5.48R
"The market is a device for transferring money from the impatient to the patient." – Warren Buffett
### ⚠️ **Disclaimer**
This is not financial advice. Always perform your own analysis and manage your risk accordingly. This is for educational purposes only.
By Dubai Traders Hub
Follow us on X , YouTube, and Join our Telegram Channel
Follow us on X , YouTube, and Join our Telegram Channel
Declinazione di responsabilità
Le informazioni e le pubblicazioni non sono intese come, e non costituiscono, consulenza o raccomandazioni finanziarie, di investimento, di trading o di altro tipo fornite o approvate da TradingView. Per ulteriori informazioni, consultare i Termini di utilizzo.