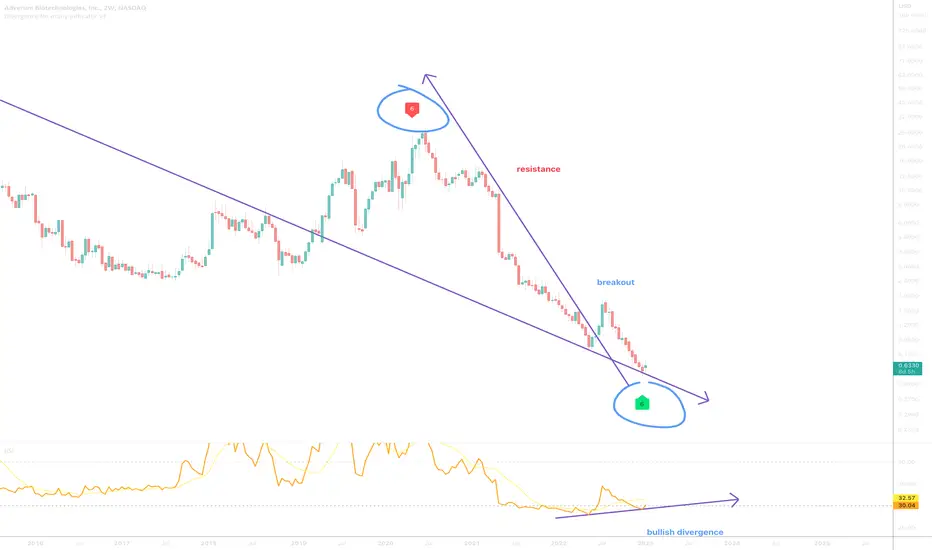
On the above bi-Weekly chart price action has corrected over 90% since June 2020. A number of reasons now exist to be bullish , including:
1) A strong buy signal prints (not shown).
2) Regular bullish divergence . Multiple oscillators printing divergence.
3) Price action confirms support on past resistance.
4) Falling wedge breakout + backtest.
Is it possible price action falls further? Sure.
Is it probable? No.
Ww
Type: trade
Risk: <=6% of portfolio
Timeframe: Don’t know.
Return: Don’t know
Stop loss: <= 50 cents
Trade attivo
Nota
support confirmedTrade attivo
GRM support confirmed.Nota
50% return so far. Hold until the resistance @ 7 dollars.Trade attivo
GRM support confirmed three times now. More bullish than a bull on steroids running on a moving treadmill chasing a slow moving red flag.Nota
230% return so far? Time to sell... If only there was a way to tell.Trade attivo
Declinazione di responsabilità
Le informazioni e le pubblicazioni non sono intese come, e non costituiscono, consulenza o raccomandazioni finanziarie, di investimento, di trading o di altro tipo fornite o approvate da TradingView. Per ulteriori informazioni, consultare i Termini di utilizzo.
Declinazione di responsabilità
Le informazioni e le pubblicazioni non sono intese come, e non costituiscono, consulenza o raccomandazioni finanziarie, di investimento, di trading o di altro tipo fornite o approvate da TradingView. Per ulteriori informazioni, consultare i Termini di utilizzo.