🚀 Amazon (AMZN) – Multi-Timeframe Technical Setup
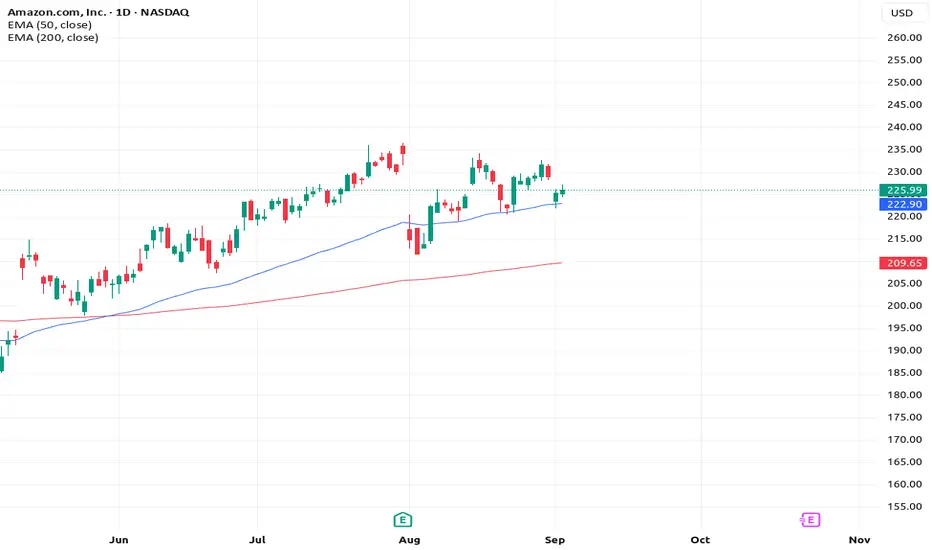
Daily Chart:
On the daily chart, the technical summary shows a neutral rating. Both the oscillators and moving averages are neutral. Digging deeper, the MACD is signaling a sell, hinting at short-term hesitation.
Weekly Chart:
Shifting to the weekly chart, the oscillator rating also appears neutral initially. However, examining momentum reveals a pullback forming—the exact setup we want to spot for a potential continuation. Bingo!
Monthly Chart:
On the monthly chart, the long-term picture is bullish. Moving averages show a strong buy, with price comfortably above the 50 EMA and 200 EMA. Add in a gap up, and Amazon looks ready for a potential upward surge.
🚀 Rocket Booster Strategy – 3 Steps
Look for neutral technical summary or short-term sell signals like MACD to identify hesitation in the short-term trend.
Examine weekly momentum indicators to find pullbacks—this is where you prepare for a continuation in the trend.
Check moving averages (50 EMA & 200 EMA). Price above these with gap-ups signals strong long-term bullish alignment—the “rocket booster” for your trade.
This combination of short-term caution, medium-term pullback, and long-term strength is the essence of the Rocket Booster Strategy.
Rocket Boost This Content To Learn More.
⚠️ Disclaimer
This article is for educational purposes only. Always use a simulation (paper) trading account to test strategies before trading live. Apply proper risk management and profit-taking strategies to protect capital.
Daily Chart:
On the daily chart, the technical summary shows a neutral rating. Both the oscillators and moving averages are neutral. Digging deeper, the MACD is signaling a sell, hinting at short-term hesitation.
Weekly Chart:
Shifting to the weekly chart, the oscillator rating also appears neutral initially. However, examining momentum reveals a pullback forming—the exact setup we want to spot for a potential continuation. Bingo!
Monthly Chart:
On the monthly chart, the long-term picture is bullish. Moving averages show a strong buy, with price comfortably above the 50 EMA and 200 EMA. Add in a gap up, and Amazon looks ready for a potential upward surge.
🚀 Rocket Booster Strategy – 3 Steps
- Daily Chart – Spot Neutral or Short-Term Weakness:
Look for neutral technical summary or short-term sell signals like MACD to identify hesitation in the short-term trend.
- Weekly Chart – Identify Momentum Pullback:
Examine weekly momentum indicators to find pullbacks—this is where you prepare for a continuation in the trend.
- Monthly Chart – Confirm Long-Term Strength:
Check moving averages (50 EMA & 200 EMA). Price above these with gap-ups signals strong long-term bullish alignment—the “rocket booster” for your trade.
This combination of short-term caution, medium-term pullback, and long-term strength is the essence of the Rocket Booster Strategy.
Rocket Boost This Content To Learn More.
⚠️ Disclaimer
This article is for educational purposes only. Always use a simulation (paper) trading account to test strategies before trading live. Apply proper risk management and profit-taking strategies to protect capital.
Pubblicazioni correlate
Declinazione di responsabilità
Le informazioni e le pubblicazioni non sono intese come, e non costituiscono, consulenza o raccomandazioni finanziarie, di investimento, di trading o di altro tipo fornite o approvate da TradingView. Per ulteriori informazioni, consultare i Termini di utilizzo.