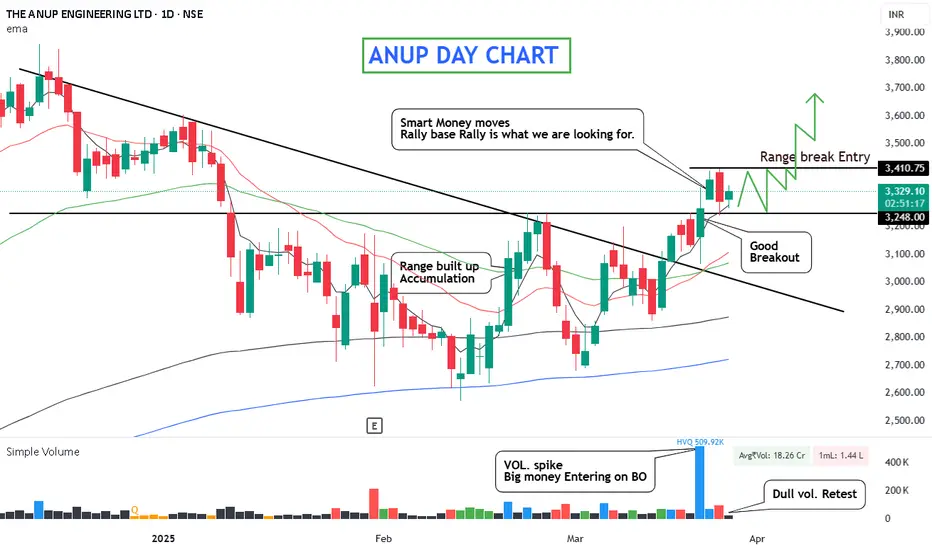
ANUP Day Chart
logic - Earlier it was in a correction mode with major market but comparatively it has fallen very less to the major indexes and also maintained its major uptrend so we can say that it have not attracted heavy sellers during fall.
Then it went into a consolidation and formed a horizontal resistance zone.
Recently it have broken out with good volume and also formed a retest of 5EMA
on low volume showing low selling.
Now What?
To qualify this Setup We need a few more days of range forming a base below - 3410 level and as per setup no big red volume on the pullback bars
Where and when is the entry - As you can see on the chart entry upon break out of base and make sure volume should be high.
(Note - if the volume is very low or below the 20-day average in the previous candle it's a good sign that sellers have gone.)
Stop - can be taken below base levels
Targets - will be 10%-20% or any subsequent channel resistance area.
Follow the rules to find perfect qualifying stocks and add them to the watchlist and observe then build a base for a few days to get familiar with the stock's behaviour.
Keep learning,
Happy Trading.
Trade attivo
5% Up today on great volumePubblicazioni correlate
Declinazione di responsabilità
Le informazioni ed i contenuti pubblicati non costituiscono in alcun modo una sollecitazione ad investire o ad operare nei mercati finanziari. Non sono inoltre fornite o supportate da TradingView. Maggiori dettagli nelle Condizioni d'uso.
Pubblicazioni correlate
Declinazione di responsabilità
Le informazioni ed i contenuti pubblicati non costituiscono in alcun modo una sollecitazione ad investire o ad operare nei mercati finanziari. Non sono inoltre fornite o supportate da TradingView. Maggiori dettagli nelle Condizioni d'uso.