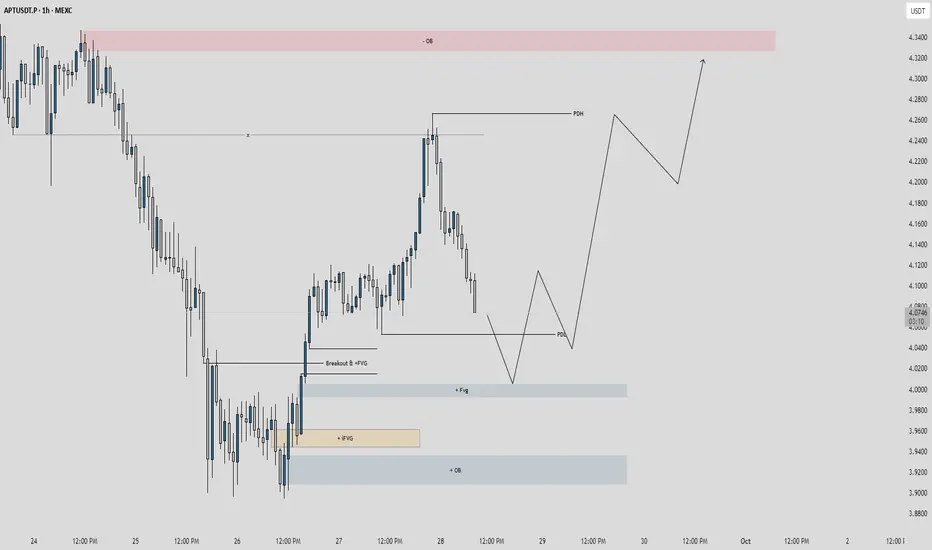
Price Action: Price broke above PDH at 4.2800 on Sep 28, showing bullish momentum, but pulled back to test support around 4.0813 (PDL).
Key Levels:
Resistance: 4.3800 (-OB, overbought zone).
Support: 4.0813 (PDL) and 4.0000 (+QB).
Zones:
Breakout +FVG: 4.0813-4.1000 (potential retest zone).
Inverted +IFVG: 3.9400-3.9600 (deeper support).
Quarter Back (+QB): 4.0000.
Trend: Bullish breakout above 4.2800, currently correcting. A hold above 4.0813 could resume the uptrend.
Long if price holds 4.0813 with confirmation target 4.2800, stop loss below 4.0600.
Trade chiuso: obiettivo raggiunto
Declinazione di responsabilità
Le informazioni ed i contenuti pubblicati non costituiscono in alcun modo una sollecitazione ad investire o ad operare nei mercati finanziari. Non sono inoltre fornite o supportate da TradingView. Maggiori dettagli nelle Condizioni d'uso.
Declinazione di responsabilità
Le informazioni ed i contenuti pubblicati non costituiscono in alcun modo una sollecitazione ad investire o ad operare nei mercati finanziari. Non sono inoltre fornite o supportate da TradingView. Maggiori dettagli nelle Condizioni d'uso.