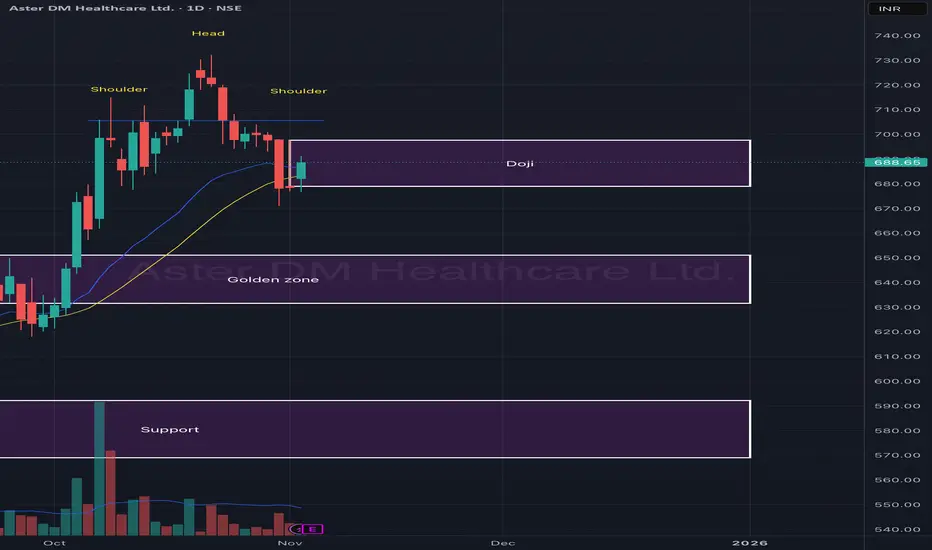
Aster DM Healthcare is currently forming a Head & Shoulders pattern, indicating potential short-term distribution after a strong uptrend. The right shoulder has developed with a Doji candle near support — suggesting indecision and possible reversal or continuation depending on the next few sessions.
The stock is hovering around its golden zone (₹640–₹660) — a critical area to watch for either a bounce or a breakdown. Sustaining above this zone can lead to recovery, while failure to hold it could push prices back to the lower support zone.
🎯 Key Levels:
CMP: ₹688.65 (+1.50%)
Pattern: Head & Shoulders
Doji Zone: ₹685 – ₹700
Golden Zone: ₹640 – ₹660 (key retracement area)
Major Support: ₹580 – ₹600
📊 Technical View:
Head & Shoulders structure forming after a sharp rally.
Doji candle shows hesitation near the neckline zone — watch next candle for confirmation.
20 EMA acting as dynamic support; breakdown below it can accelerate selling.
Volume contraction indicates reduced momentum — possible retest ahead.
🧠 View:
Aster DM is at a key decision point. A daily close above ₹700 could invalidate the bearish setup and trigger recovery, while a breakdown below ₹660 may lead to a slide toward ₹600. The Doji formation adds to the significance of the next move.
Declinazione di responsabilità
Le informazioni ed i contenuti pubblicati non costituiscono in alcun modo una sollecitazione ad investire o ad operare nei mercati finanziari. Non sono inoltre fornite o supportate da TradingView. Maggiori dettagli nelle Condizioni d'uso.
Declinazione di responsabilità
Le informazioni ed i contenuti pubblicati non costituiscono in alcun modo una sollecitazione ad investire o ad operare nei mercati finanziari. Non sono inoltre fornite o supportate da TradingView. Maggiori dettagli nelle Condizioni d'uso.