The chart of Avalon Technologies is currently sitting at a very interesting location where both advanced Demand–Supply principles and traditional technical analysis are telling a powerful story.
Let’s break the entire analysis into two separate parts so traders of all styles can understand what the chart is silently revealing.
🟢 Advanced Demand & Supply Zone Analysis 🔍
These characteristics indicate that the current decline is not a bearish fall, but simply a normal pullback within a larger uptrend, supporting the possibility of trend continuation as long as the demand zone remains intact.
📌 Curve Analysis Viewpoint
Since price rallied strongly, broke the all-time high, and has now returned to a previously created RBR demand origin:
📊 Traditional Technical Analysis Perspective 📈
Switching to classical TA, the chart confirms the Demand–Supply story from another angle.
📉 Trendline & Structure Analysis
The stock has respected an ascending trendline for months. Every time price approached it:
Price is currently reacting near this trendline once again, suggesting structural strength.
🔄 Support Turned Resistance… Now Turned Support
A wide consolidation zone from the previous range, which acted as resistance earlier, has now flipped into support.
This phenomenon—resistance becoming support—is one of the strongest confluences in price action.
📌 Candlestick Behaviour
The rejection candles forming on the pullback indicate that:
📉 Volume Confirmation
Volume shows a typical pattern seen during healthy retracements:
🧩 Combined Insight From Classical TA
When a rising trendline, a former resistance-turned-support, and bullish rejection candles align together, the setup represents a high probability continuation scenario—as long as the broader trend remains intact.
🌟 Final Outlook 🌟
When evaluated independently, both Advanced Demand–Supply analysis & Traditional technical analysis reach the same conclusion:
“The stock is currently reacting from a strong area of institutional interest within an intact uptrend.”
The Price appears positioned for continuation—unless the nearest strong demand zone is cleanly violated in the future.
🔥 Trading is a journey of patience, discipline, and constant learning — every candle tells a story, keep reading the market with confidence! 🔥
Lastly, thank you for your support, your likes & comments. Feel free to ask if you have questions.
This analysis is strictly for educational purposes only. I am not a SEBI-registered analyst.
Let’s break the entire analysis into two separate parts so traders of all styles can understand what the chart is silently revealing.
🟢 Advanced Demand & Supply Zone Analysis 🔍
- Price formed a clean Rally–Base–Rally (RBR) demand zone earlier, which later pushed the market strongly upward and even broke the all-time high, creating a new high point.
- After making this new high, the stock pulled back naturally toward the same RBR demand zone — a textbook return-to-origin move.
- As price reached the zone, we can clearly see a reversal candle forming right inside the demand, confirming that sellers are losing momentum and buyers are defending the zone again.
These characteristics indicate that the current decline is not a bearish fall, but simply a normal pullback within a larger uptrend, supporting the possibility of trend continuation as long as the demand zone remains intact.
📌 Curve Analysis Viewpoint
Since price rallied strongly, broke the all-time high, and has now returned to a previously created RBR demand origin:
- There are no higher-timeframe supply zones above the current price structure, This positions the stock low on the curve.
- Being low on the curve generally supports buying continuation trades, especially when aligned with a fresh demand zone.
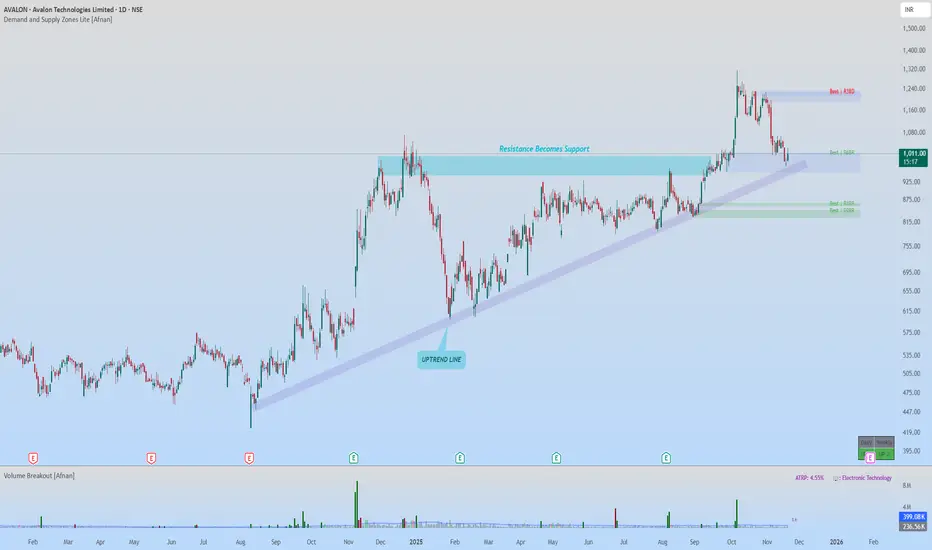
📊 Traditional Technical Analysis Perspective 📈
Switching to classical TA, the chart confirms the Demand–Supply story from another angle.
📉 Trendline & Structure Analysis
The stock has respected an ascending trendline for months. Every time price approached it:
- Buyers stepped in
- higher lows were maintained
- Trendline acted as dynamic support
Price is currently reacting near this trendline once again, suggesting structural strength.
🔄 Support Turned Resistance… Now Turned Support
A wide consolidation zone from the previous range, which acted as resistance earlier, has now flipped into support.
This phenomenon—resistance becoming support—is one of the strongest confluences in price action.
📌 Candlestick Behaviour
The rejection candles forming on the pullback indicate that:
- Sellers could not maintain control
- Buyers absorbed aggressive selling
- Wicks show institutional order collection at lower prices
📉 Volume Confirmation
Volume shows a typical pattern seen during healthy retracements:
- Strong volume on rallies
- Falling volume on pullbacks
- Occasional spikes confirming institutional footprints
🧩 Combined Insight From Classical TA
When a rising trendline, a former resistance-turned-support, and bullish rejection candles align together, the setup represents a high probability continuation scenario—as long as the broader trend remains intact.
🌟 Final Outlook 🌟
When evaluated independently, both Advanced Demand–Supply analysis & Traditional technical analysis reach the same conclusion:
“The stock is currently reacting from a strong area of institutional interest within an intact uptrend.”
The Price appears positioned for continuation—unless the nearest strong demand zone is cleanly violated in the future.
🔥 Trading is a journey of patience, discipline, and constant learning — every candle tells a story, keep reading the market with confidence! 🔥
Lastly, thank you for your support, your likes & comments. Feel free to ask if you have questions.
This analysis is strictly for educational purposes only. I am not a SEBI-registered analyst.
Access the powerful Demand and Supply Zone Pro indicator at:
marketup2date.com
Stay updated on Telegram:
t.me/MarketUp2Date
Join our WhatsApp channel:
whatsapp.com/channel/0029Va6ByyH0LKZCc4Az4x0u
marketup2date.com
Stay updated on Telegram:
t.me/MarketUp2Date
Join our WhatsApp channel:
whatsapp.com/channel/0029Va6ByyH0LKZCc4Az4x0u
Pubblicazioni correlate
Declinazione di responsabilità
Le informazioni e le pubblicazioni non sono intese come, e non costituiscono, consulenza o raccomandazioni finanziarie, di investimento, di trading o di altro tipo fornite o approvate da TradingView. Per ulteriori informazioni, consultare i Termini di utilizzo.