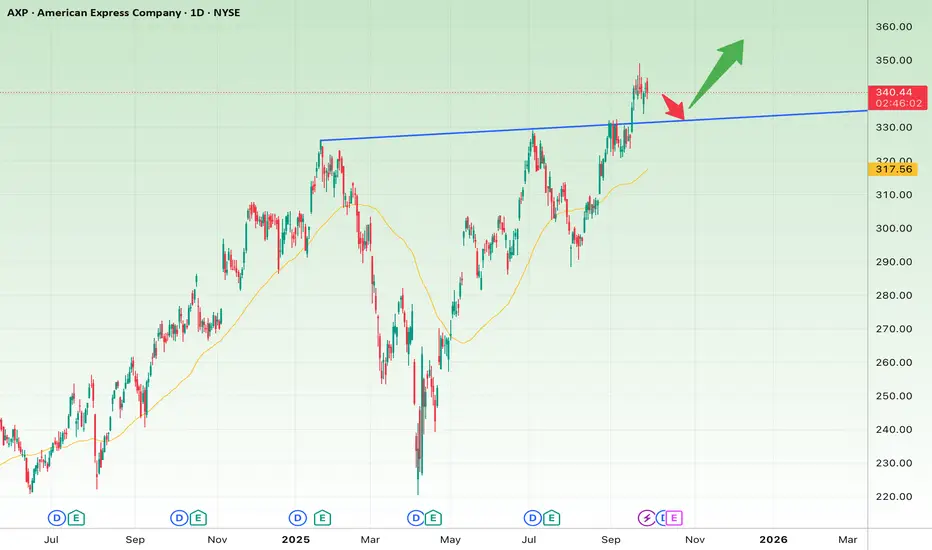
Looking at the daily chart of AXP, here’s a breakdown:
📊 Short-Term Outlook (1–4 weeks)
Price Structure: The stock has broken above its previous all-time high (~$335–337) and is now attempting to hold above it.
Risk: A pullback to the breakout level is possible (red arrow on chart).
Key Support: $335–330 (breakout level + trendline).
Short-Term Stop Loss: Below $330 (on a confirmed daily close).
Short-Term Target: $350–355.
➡️ As long as AXP holds above $335, the short-term trend favors continuation toward $350–355.
📊 Long-Term Outlook (2–6 months)
Primary Trend: Still bullish, with the 50-day moving average acting as dynamic support.
Major Support Zone: $317 (50-day MA + key swing low).
Long-Term Stop Loss: Below $317 on a confirmed close.
Long-Term Targets: If price breaks and sustains above $355, the next levels are $370 and $390.
➡️ The long-term uptrend remains intact unless price falls below $317.
🎯 Summary
Short-Term Trade Idea: Buy above $335, target $350–355, stop loss at $330.
Long-Term Position: Hold above $317 with upside targets at $370 and $390.
Declinazione di responsabilità
Le informazioni e le pubblicazioni non sono intese come, e non costituiscono, consulenza o raccomandazioni finanziarie, di investimento, di trading o di altro tipo fornite o approvate da TradingView. Per ulteriori informazioni, consultare i Termini di utilizzo.
Declinazione di responsabilità
Le informazioni e le pubblicazioni non sono intese come, e non costituiscono, consulenza o raccomandazioni finanziarie, di investimento, di trading o di altro tipo fornite o approvate da TradingView. Per ulteriori informazioni, consultare i Termini di utilizzo.