4-Hour Chart (Macro Trend)
Structure: The Bank Nifty has experienced a sharp correction, breaking below the lower trendline of the aggressive ascending channel. This signals a clear Market Structure Shift (MSS) on the steep short-term momentum. The aggressive bearish candle (Oct 24th) shows strong profit-booking from the ATH. The current price is testing the 57,750 - 58,000 zone, which now acts as overhead resistance.
Key Levels:
Major Supply (Resistance): 58,100 - 58,300. This area (the breakdown level and the FVG on the chart) is the immediate overhead resistance.
Major Demand (Support): 57,100 - 57,300. This area, which includes the lower channel trendline and a strong FVG (Fair Value Gap), is the must-hold zone to prevent a further large correction.
Outlook: The bias is Corrective within an Uptrend. We expect the market to consolidate or retest the 57,100 support before any bullish move.
1-Hour Chart (Intermediate View)
Structure: The 1H chart shows a clear breakdown from the steep ascending channel. The price is now trading within a descending channel, confirming the short-term correction. The close is just above the 57,600 support level.
Key Levels:
Immediate Resistance: 57,900 - 58,000 (Psychological mark and breakdown level).
Immediate Support: 57,500 - 57,600 (Lower channel boundary/FVG zone).
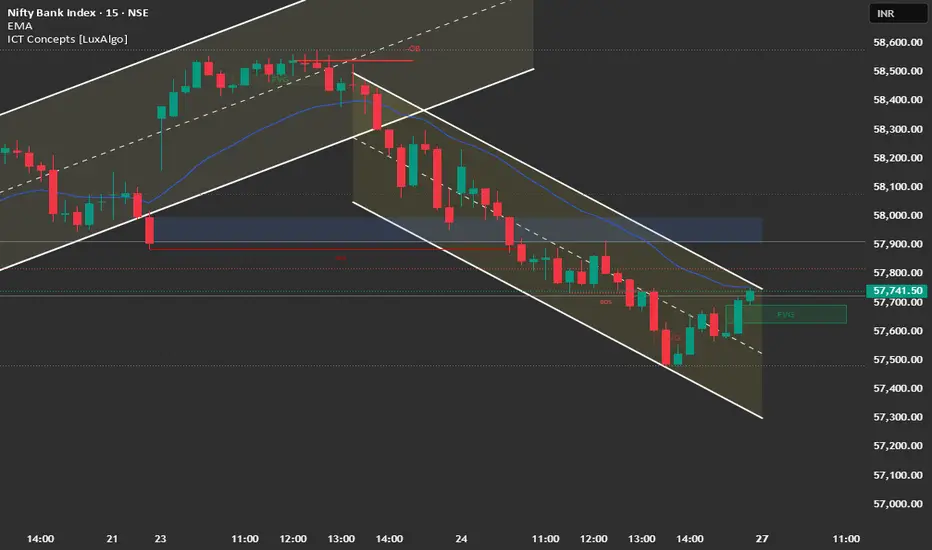
15-Minute Chart (Intraday View)
Structure: The 15M chart confirms the steep descending channel and strong intraday bearish control. The price closed right on the lower boundary of a small FVG area, suggesting a temporary bounce is possible at the open, but the overall bias is to the downside.
Key Levels:
Intraday Supply: 57,900.
Intraday Demand: 57,200.
Outlook: Neutral-to-Bearish for the session open. A "Sell on Rise" strategy is favorable.
📈 Structure Analysis & Trade Plan: 27th October
Market Outlook: Bank Nifty is undergoing a sharp correction after hitting a new ATH. The key battleground is the 57,100 - 57,300 FVG zone.
Bearish Scenario (Primary Plan: Correction Continuation/Sell on Rise)
Justification: The sharp breakdown below the channel and the loss of momentum from the ATH favor a deeper correction toward the major demand zone.
Entry: Short entry on a retest and rejection of the 57,900 - 58,100 zone (breakdown level) OR Short a decisive break and 15-minute candle close below 57,500.
Stop Loss (SL): Place a stop loss above 58,300 (above the last swing high).
Targets:
T1: 57,300 (Major FVG support).
T2: 57,100 (Strong Demand Zone).
T3: 56,800 (Deeper FVG).
Bullish Scenario (Counter-Trend/Reversal)
Justification: Only valid if strong buying emerges to defend the major structural support and reclaim the bullish momentum.
Trigger: A sustained move and close above 58,200.
Entry: Long entry on a confirmed 15-minute close above 58,200.
Stop Loss (SL): Below 57,800.
Targets:
T1: 58,577 (All-Time High retest).
T2: 59,000 (Psychological extension target).
Key Levels for Observation:
Immediate Decision Point: 57,500 - 58,100 zone.
Bearish Confirmation: Sustained trade below 57,500.
Bullish Warning: A move back above 58,100.
Line in the Sand: 57,100. A break below this level shifts the medium-term bias to a deeper corrective phase.
Structure: The Bank Nifty has experienced a sharp correction, breaking below the lower trendline of the aggressive ascending channel. This signals a clear Market Structure Shift (MSS) on the steep short-term momentum. The aggressive bearish candle (Oct 24th) shows strong profit-booking from the ATH. The current price is testing the 57,750 - 58,000 zone, which now acts as overhead resistance.
Key Levels:
Major Supply (Resistance): 58,100 - 58,300. This area (the breakdown level and the FVG on the chart) is the immediate overhead resistance.
Major Demand (Support): 57,100 - 57,300. This area, which includes the lower channel trendline and a strong FVG (Fair Value Gap), is the must-hold zone to prevent a further large correction.
Outlook: The bias is Corrective within an Uptrend. We expect the market to consolidate or retest the 57,100 support before any bullish move.
1-Hour Chart (Intermediate View)
Structure: The 1H chart shows a clear breakdown from the steep ascending channel. The price is now trading within a descending channel, confirming the short-term correction. The close is just above the 57,600 support level.
Key Levels:
Immediate Resistance: 57,900 - 58,000 (Psychological mark and breakdown level).
Immediate Support: 57,500 - 57,600 (Lower channel boundary/FVG zone).
15-Minute Chart (Intraday View)
Structure: The 15M chart confirms the steep descending channel and strong intraday bearish control. The price closed right on the lower boundary of a small FVG area, suggesting a temporary bounce is possible at the open, but the overall bias is to the downside.
Key Levels:
Intraday Supply: 57,900.
Intraday Demand: 57,200.
Outlook: Neutral-to-Bearish for the session open. A "Sell on Rise" strategy is favorable.
📈 Structure Analysis & Trade Plan: 27th October
Market Outlook: Bank Nifty is undergoing a sharp correction after hitting a new ATH. The key battleground is the 57,100 - 57,300 FVG zone.
Bearish Scenario (Primary Plan: Correction Continuation/Sell on Rise)
Justification: The sharp breakdown below the channel and the loss of momentum from the ATH favor a deeper correction toward the major demand zone.
Entry: Short entry on a retest and rejection of the 57,900 - 58,100 zone (breakdown level) OR Short a decisive break and 15-minute candle close below 57,500.
Stop Loss (SL): Place a stop loss above 58,300 (above the last swing high).
Targets:
T1: 57,300 (Major FVG support).
T2: 57,100 (Strong Demand Zone).
T3: 56,800 (Deeper FVG).
Bullish Scenario (Counter-Trend/Reversal)
Justification: Only valid if strong buying emerges to defend the major structural support and reclaim the bullish momentum.
Trigger: A sustained move and close above 58,200.
Entry: Long entry on a confirmed 15-minute close above 58,200.
Stop Loss (SL): Below 57,800.
Targets:
T1: 58,577 (All-Time High retest).
T2: 59,000 (Psychological extension target).
Key Levels for Observation:
Immediate Decision Point: 57,500 - 58,100 zone.
Bearish Confirmation: Sustained trade below 57,500.
Bullish Warning: A move back above 58,100.
Line in the Sand: 57,100. A break below this level shifts the medium-term bias to a deeper corrective phase.
Declinazione di responsabilità
Le informazioni e le pubblicazioni non sono intese come, e non costituiscono, consulenza o raccomandazioni finanziarie, di investimento, di trading o di altro tipo fornite o approvate da TradingView. Per ulteriori informazioni, consultare i Termini di utilizzo.
Declinazione di responsabilità
Le informazioni e le pubblicazioni non sono intese come, e non costituiscono, consulenza o raccomandazioni finanziarie, di investimento, di trading o di altro tipo fornite o approvate da TradingView. Per ulteriori informazioni, consultare i Termini di utilizzo.