📊 BANKNIFTY TRADING PLAN — 21 NOV 2025
(Reference: 15-min chart structure & mapped intraday zones)
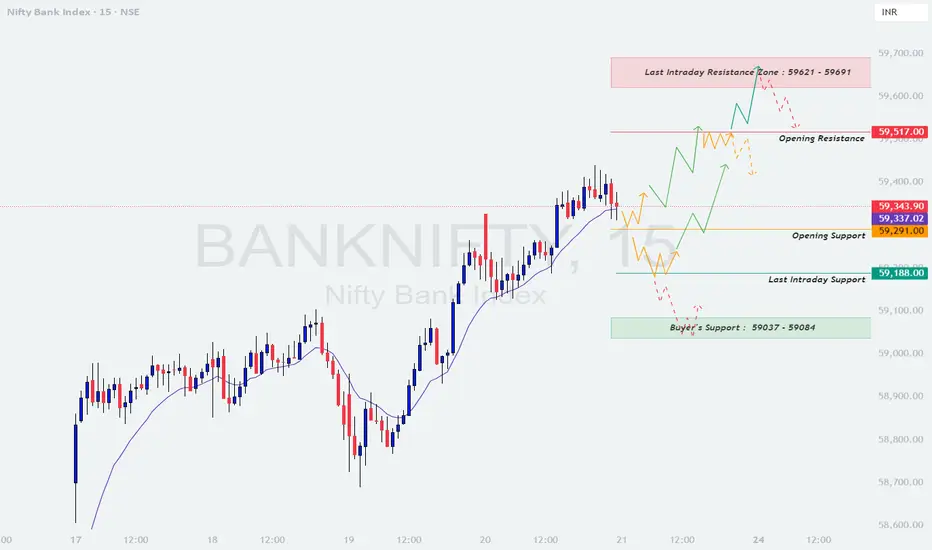
BankNifty closed around 59,343, trading just above Opening Support (59,291) and below the critical Opening Resistance (59,517).
Trend is bullish, but price is consolidating near a supply zone, making open behaviour extremely important.
Here are the major actionable levels for 21 Nov:
🟧 Opening Resistance: 59,517
🟥 Last Intraday Resistance Zone: 59,621 – 59,691
🟩 Opening Support: 59,291
🟦 Last Intraday Support: 59,188
🟩 Buyer’s Support Zone: 59,037 – 59,084 (Trend Reversal Zone)
🟢 SCENARIO 1 — GAP-UP OPENING (200+ points)
If BankNifty opens around 59,500–59,650, price opens directly at or inside resistance areas.
📘 Educational Note:
Gap-ups near resistance zones often fail if the first 5–15 min candle is weak. Always wait for higher-low confirmation before entering longs.
🟧 SCENARIO 2 — FLAT OPENING (Near 59,250–59,350)
A flat open places price between Opening Support (59,291) and Opening Resistance (59,517) — a decision zone.
💡 Educational Tip:
Flat openings are ideal for trend discovery. The first 15-min structure gives the strongest clue—don’t anticipate, let levels break.
🔻 SCENARIO 3 — GAP-DOWN OPENING (200+ points)
If BankNifty opens below 59,150, price enters a crucial demand area.
📘 Educational Note:
Gap-downs into strong demand zones give powerful reversals, but only after confirmation. Never buy falling candles blindly.
💼 RISK MANAGEMENT TIPS FOR OPTION TRADERS 💡
⚠️ Golden Rule:
Survive first, profit second. Capital protection creates consistency.
📌 SUMMARY
Bullish above → 59,517
🎯 Targets → 59,580 → 59,621 → 59,691
Bearish below → 59,291
🎯 Targets → 59,240 → 59,188 → 59,084
Strong Reversal Zone (for bounce trades):
✔️ 59,037 – 59,084
Key No-Trade Zone:
— 59,291 – 59,517 (Flat opening chop area)
🧾 CONCLUSION
BankNifty is at a critical decision point between 59,291–59,517, and the breakout or breakdown from this zone will drive the intraday trend.
The cleanest trades will come from:
✔️ Breakout + Retest above 59,517
✔️ Reversal from 59,037–59,084
✔️ Breakdown + Retest below 59,291
Avoid chop zones, wait for confirmation, and execute with discipline.
⚠️ DISCLAIMER
I am not a SEBI-registered analyst.
This analysis is for educational purposes only.
Please consult a certified financial advisor before making any trading decisions.
(Reference: 15-min chart structure & mapped intraday zones)
BankNifty closed around 59,343, trading just above Opening Support (59,291) and below the critical Opening Resistance (59,517).
Trend is bullish, but price is consolidating near a supply zone, making open behaviour extremely important.
Here are the major actionable levels for 21 Nov:
🟧 Opening Resistance: 59,517
🟥 Last Intraday Resistance Zone: 59,621 – 59,691
🟩 Opening Support: 59,291
🟦 Last Intraday Support: 59,188
🟩 Buyer’s Support Zone: 59,037 – 59,084 (Trend Reversal Zone)
🟢 SCENARIO 1 — GAP-UP OPENING (200+ points)
If BankNifty opens around 59,500–59,650, price opens directly at or inside resistance areas.
- []If price sustains above 59,517 for 10–15 minutes with strong bullish candles →
🎯 Upside targets → 59,621 → 59,691 → 59,750
[]If price enters the Last Intraday Resistance Zone (59,621–59,691), expect:
🔻 Profit booking / intraday reversal
💡 Book long profits here and avoid fresh buys.
[]Rejection from 59,620–59,690 can retrace toward:
➡️ 59,517 → 59,420 → 59,291
[]A bullish retest at 59,517 is a safe re-entry for continuation.
📘 Educational Note:
Gap-ups near resistance zones often fail if the first 5–15 min candle is weak. Always wait for higher-low confirmation before entering longs.
🟧 SCENARIO 2 — FLAT OPENING (Near 59,250–59,350)
A flat open places price between Opening Support (59,291) and Opening Resistance (59,517) — a decision zone.
- []Breakout above 59,517 →
🎯 Targets → 59,580 → 59,621 → 59,691
[]Breakdown below 59,291 →
🎯 Targets → 59,240 → 59,188
[]Avoid trading inside the 59,291–59,517 zone until a clear direction forms.
[]Best strategy:
✔️ Breakout → Retest → Long
✔️ Breakdown → Retest → Short
💡 Educational Tip:
Flat openings are ideal for trend discovery. The first 15-min structure gives the strongest clue—don’t anticipate, let levels break.
🔻 SCENARIO 3 — GAP-DOWN OPENING (200+ points)
If BankNifty opens below 59,150, price enters a crucial demand area.
- []A gap-down near 59,188 (Last Intraday Support):
If price gives bullish wick rejection →
🎯 Targets → 59,240 → 59,291 → 59,337
[]If 59,188 breaks decisively →
Next major demand zone → 59,037 – 59,084 (Buyer’s Support Zone)
[]Expect a strong reversal attempt from 59,037–59,084.
A bullish reversal candle here is a high-probability long setup.
[]If 59,037 breaks →
Downside expansion → 58,950 → 58,880
📘 Educational Note:
Gap-downs into strong demand zones give powerful reversals, but only after confirmation. Never buy falling candles blindly.
💼 RISK MANAGEMENT TIPS FOR OPTION TRADERS 💡
- []Avoid trading during the first 5–10 minutes — high volatility = high risk.
[]For directional trades → Use ATM or ITM options for better decay control.
[]Maintain a fixed SL based on structure, not on emotions.
[]Avoid averaging losers — trend can continue longer than expected.
[]Book partial profits if momentum slows near resistance or support.
[]In low VIX → option buying works well.
In high VIX → prefer spreads or hedged selling. - Trail SL once BankNifty breaks out with momentum.
⚠️ Golden Rule:
Survive first, profit second. Capital protection creates consistency.
📌 SUMMARY
Bullish above → 59,517
🎯 Targets → 59,580 → 59,621 → 59,691
Bearish below → 59,291
🎯 Targets → 59,240 → 59,188 → 59,084
Strong Reversal Zone (for bounce trades):
✔️ 59,037 – 59,084
Key No-Trade Zone:
— 59,291 – 59,517 (Flat opening chop area)
🧾 CONCLUSION
BankNifty is at a critical decision point between 59,291–59,517, and the breakout or breakdown from this zone will drive the intraday trend.
The cleanest trades will come from:
✔️ Breakout + Retest above 59,517
✔️ Reversal from 59,037–59,084
✔️ Breakdown + Retest below 59,291
Avoid chop zones, wait for confirmation, and execute with discipline.
⚠️ DISCLAIMER
I am not a SEBI-registered analyst.
This analysis is for educational purposes only.
Please consult a certified financial advisor before making any trading decisions.
Declinazione di responsabilità
Le informazioni e le pubblicazioni non sono intese come, e non costituiscono, consulenza o raccomandazioni finanziarie, di investimento, di trading o di altro tipo fornite o approvate da TradingView. Per ulteriori informazioni, consultare i Termini di utilizzo.
Declinazione di responsabilità
Le informazioni e le pubblicazioni non sono intese come, e non costituiscono, consulenza o raccomandazioni finanziarie, di investimento, di trading o di altro tipo fornite o approvate da TradingView. Per ulteriori informazioni, consultare i Termini di utilizzo.