BANKNIFTY TRADING PLAN – 03-Nov-2025
📊 Prepared by LiveTradingBox | Based on 15-min chart structure & psychological correction theory
🔍 Key Reference Levels:
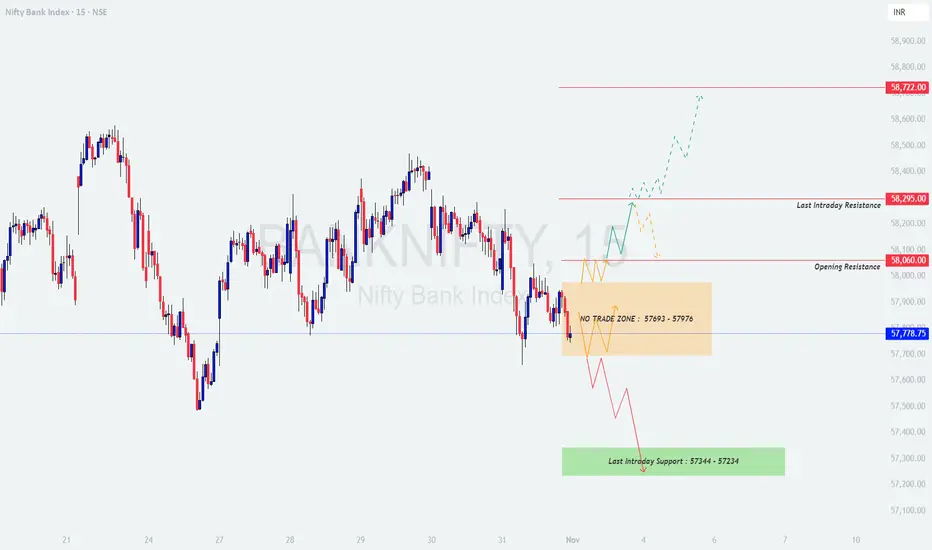
🟩 Last Intraday Support: 57,344 – 57,234
🟧 No Trade Zone: 57,693 – 57,976
🟨 Opening Resistance: 58,060
🟥 Last Intraday Resistance: 58,295
🔺 Profit Booking Zone: 58,722
🟢 1. Gap-Up Opening (Above 58,060 – 200+ points)
If Bank Nifty opens above 58,060, it reflects a bullish sentiment driven by overnight momentum or positive global cues. However, the key test will be whether the index can sustain above this breakout zone or not.
Plan of Action:
📘 Educational Insight:
Chasing a gap-up is one of the most common retail trader mistakes. Professionals wait for confirmation near resistance retests or structure validation to ensure they’re aligning with institutional flow rather than speculative enthusiasm.
🟦 2. Flat Opening (Around 57,750 ±100 points)
A flat start near the midpoint of the No Trade Zone (57,693 – 57,976) indicates indecision and balance between buyers and sellers. Patience is crucial here, as this range acts as a neutral ground where false signals can easily trap traders.
Plan of Action:
📘 Educational Insight:
Flat openings are where discipline and patience pay off. Avoid trading “inside noise” — wait for price to leave the neutral range with conviction before joining the move.
🔻 3. Gap-Down Opening (Below 57,600 – 200+ points)
A gap-down below 57,600 signals weakness or profit booking, especially if it’s accompanied by negative global cues. The support zone of 57,344 – 57,234 becomes the key area to watch for buyer reactions.
Plan of Action:
📘 Educational Insight:
Gap-downs often trigger emotional selling among retail participants. However, observing price reactions at support zones helps identify whether the move is panic-driven or part of a larger corrective phase.
🧠 Risk Management Tips for Options Traders:
📈 Summary & Conclusion:
⚠️ Disclaimer:
I am not a SEBI-registered analyst. This analysis is intended purely for educational and informational purposes. Traders and investors should perform their own research or consult with a financial advisor before taking any trading or investment decisions.
📊 Prepared by LiveTradingBox | Based on 15-min chart structure & psychological correction theory
🔍 Key Reference Levels:
🟩 Last Intraday Support: 57,344 – 57,234
🟧 No Trade Zone: 57,693 – 57,976
🟨 Opening Resistance: 58,060
🟥 Last Intraday Resistance: 58,295
🔺 Profit Booking Zone: 58,722
🟢 1. Gap-Up Opening (Above 58,060 – 200+ points)
If Bank Nifty opens above 58,060, it reflects a bullish sentiment driven by overnight momentum or positive global cues. However, the key test will be whether the index can sustain above this breakout zone or not.
Plan of Action:
- [] Wait for the first 15–20 minutes to let early volatility settle.
[] A retest and strong candle close above 58,060 can trigger fresh buying opportunities.
[] Initial targets will be 58,295 (last intraday resistance) and then 58,722 (profit booking zone).
[] Maintain a stop loss below 57,950 on an hourly close basis for positional trades. - If Bank Nifty rejects from 58,295 with heavy volume, consider partial profit booking or a light counter short scalp targeting 58,000 – 57,900.
📘 Educational Insight:
Chasing a gap-up is one of the most common retail trader mistakes. Professionals wait for confirmation near resistance retests or structure validation to ensure they’re aligning with institutional flow rather than speculative enthusiasm.
🟦 2. Flat Opening (Around 57,750 ±100 points)
A flat start near the midpoint of the No Trade Zone (57,693 – 57,976) indicates indecision and balance between buyers and sellers. Patience is crucial here, as this range acts as a neutral ground where false signals can easily trap traders.
Plan of Action:
- [] Avoid entering immediately after the open — the market needs time to reveal direction.
[] Wait for a breakout above 57,976 for potential upside movement toward 58,060 – 58,295.
[] A breakdown below 57,693 may trigger weakness toward 57,344 – 57,234.
[] Do not trade within the No Trade Zone to avoid choppy moves and unnecessary losses. - Focus on candle confirmations — avoid pre-empting breakouts or breakdowns.
📘 Educational Insight:
Flat openings are where discipline and patience pay off. Avoid trading “inside noise” — wait for price to leave the neutral range with conviction before joining the move.
🔻 3. Gap-Down Opening (Below 57,600 – 200+ points)
A gap-down below 57,600 signals weakness or profit booking, especially if it’s accompanied by negative global cues. The support zone of 57,344 – 57,234 becomes the key area to watch for buyer reactions.
Plan of Action:
- [] Monitor price behavior near 57,344 – 57,234. If Bank Nifty forms a strong bullish reversal candle (hammer or engulfing), it can offer a potential intraday long setup.
[] Targets for such a bounce can be 57,600 – 57,800, but avoid overextending trades unless strong momentum follows.
[] Keep a strict stop loss below 57,200 to protect from deeper slides.
[] If the support fails to hold and price sustains below 57,234, expect continued weakness toward 57,000 – 56,850 levels. - Avoid aggressive averaging — trend continuation can accelerate in such cases.
📘 Educational Insight:
Gap-downs often trigger emotional selling among retail participants. However, observing price reactions at support zones helps identify whether the move is panic-driven or part of a larger corrective phase.
🧠 Risk Management Tips for Options Traders:
- [] Never enter trades based on emotions — use defined entry and exit levels.
[] Avoid buying options during the first 15 minutes of the session; volatility premium is highest then.
[] Prefer ATM or slightly ITM options for directional trades — they offer better delta control.
[] Stick to a maximum risk limit of 2–3% per trade.
[] If you hit your daily loss limit, step aside and protect your capital — survival > prediction.
[] Keep monitoring time decay, especially post 2 PM — theta accelerates rapidly.
📈 Summary & Conclusion:
- [] Above 58,060, trend bias is bullish toward 58,295 – 58,722, provided the level sustains.
[] Between 57,693 – 57,976, stay neutral — it’s a No Trade Zone; let direction confirm.
[] Below 57,600, expect weakness until support near 57,344 – 57,234 reacts.
[] Patience, observation, and disciplined execution are key to consistent results.
⚠️ Disclaimer:
I am not a SEBI-registered analyst. This analysis is intended purely for educational and informational purposes. Traders and investors should perform their own research or consult with a financial advisor before taking any trading or investment decisions.
Declinazione di responsabilità
Le informazioni e le pubblicazioni non sono intese come, e non costituiscono, consulenza o raccomandazioni finanziarie, di investimento, di trading o di altro tipo fornite o approvate da TradingView. Per ulteriori informazioni, consultare i Termini di utilizzo.
Declinazione di responsabilità
Le informazioni e le pubblicazioni non sono intese come, e non costituiscono, consulenza o raccomandazioni finanziarie, di investimento, di trading o di altro tipo fornite o approvate da TradingView. Per ulteriori informazioni, consultare i Termini di utilizzo.