📊 Market Structure (BankNifty)
🔹 4H Chart
Clear downtrend channel intact (lower highs & lower lows).
Price recently bounced from 54,600 demand zone and is hovering around 55,200–55,400 supply zone.
Overhead resistances at 55,800 → 56,200 → 57,200 remain strong.
Trend remains bearish-to-sideways until a clean break above 56,000+.
🔹 1H Chart
Price is consolidating between 55,200 (support) and 55,600 (resistance).
Sellers are defending 55,600; repeated rejections show supply pressure.
Below 55,200, next demand is 54,800–54,600.
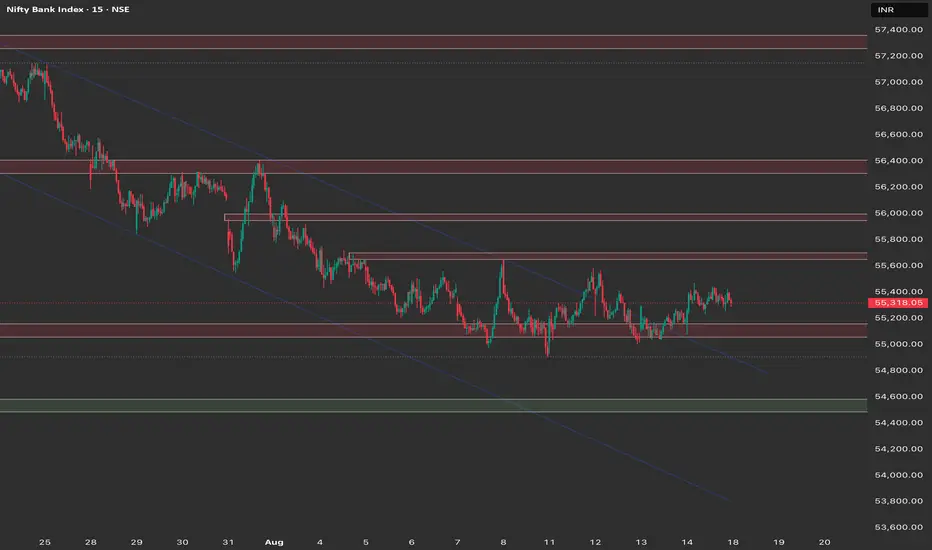
🔹 15M Chart
Short-term structure: range-bound chop between 55,200–55,600.
Intraday traders should watch for a breakout/breakdown from this box for directional momentum.
🎯 Trade Plan for 18th August (Monday)
📈 Bullish Plan
Entry: Above 55,600 breakout (sustained with volume).
Targets:
55,800
56,200
Stop Loss: 55,350 (below breakout candle low).
Note: Only aggressive buying above 55,600; until then upside capped.
📉 Bearish Plan
Entry 1: On rejection near 55,600 zone.
Target: 55,200 → 54,800 → 54,600
SL: 55,700
Entry 2: Breakdown below 55,200.
Target: 54,800 → 54,600
SL: 55,400
⚖️ Neutral / Sideways Bias
If price stays between 55,200–55,600, expect chop.
Best to avoid over-trading inside this zone — wait for clear direction.
📝 Summary
Bias: Sideways-to-bearish unless BankNifty closes above 55,600.
Key Levels:
Support: 55,200 → 54,800 → 54,600
Resistance: 55,600 → 55,800 → 56,200
Strategy: Sell on rise near resistances until 55,600 is taken out. Only above 55,600 can we play for 56,200+.
🔹 4H Chart
Clear downtrend channel intact (lower highs & lower lows).
Price recently bounced from 54,600 demand zone and is hovering around 55,200–55,400 supply zone.
Overhead resistances at 55,800 → 56,200 → 57,200 remain strong.
Trend remains bearish-to-sideways until a clean break above 56,000+.
🔹 1H Chart
Price is consolidating between 55,200 (support) and 55,600 (resistance).
Sellers are defending 55,600; repeated rejections show supply pressure.
Below 55,200, next demand is 54,800–54,600.
🔹 15M Chart
Short-term structure: range-bound chop between 55,200–55,600.
Intraday traders should watch for a breakout/breakdown from this box for directional momentum.
🎯 Trade Plan for 18th August (Monday)
📈 Bullish Plan
Entry: Above 55,600 breakout (sustained with volume).
Targets:
55,800
56,200
Stop Loss: 55,350 (below breakout candle low).
Note: Only aggressive buying above 55,600; until then upside capped.
📉 Bearish Plan
Entry 1: On rejection near 55,600 zone.
Target: 55,200 → 54,800 → 54,600
SL: 55,700
Entry 2: Breakdown below 55,200.
Target: 54,800 → 54,600
SL: 55,400
⚖️ Neutral / Sideways Bias
If price stays between 55,200–55,600, expect chop.
Best to avoid over-trading inside this zone — wait for clear direction.
📝 Summary
Bias: Sideways-to-bearish unless BankNifty closes above 55,600.
Key Levels:
Support: 55,200 → 54,800 → 54,600
Resistance: 55,600 → 55,800 → 56,200
Strategy: Sell on rise near resistances until 55,600 is taken out. Only above 55,600 can we play for 56,200+.
Declinazione di responsabilità
Le informazioni e le pubblicazioni non sono intese come, e non costituiscono, consulenza o raccomandazioni finanziarie, di investimento, di trading o di altro tipo fornite o approvate da TradingView. Per ulteriori informazioni, consultare i Termini di utilizzo.
Declinazione di responsabilità
Le informazioni e le pubblicazioni non sono intese come, e non costituiscono, consulenza o raccomandazioni finanziarie, di investimento, di trading o di altro tipo fornite o approvate da TradingView. Per ulteriori informazioni, consultare i Termini di utilizzo.