📊 BANK NIFTY TRADING PLAN — 11 NOV 2025
(Timeframe Reference: 15-Min Chart)
Chart Summary:
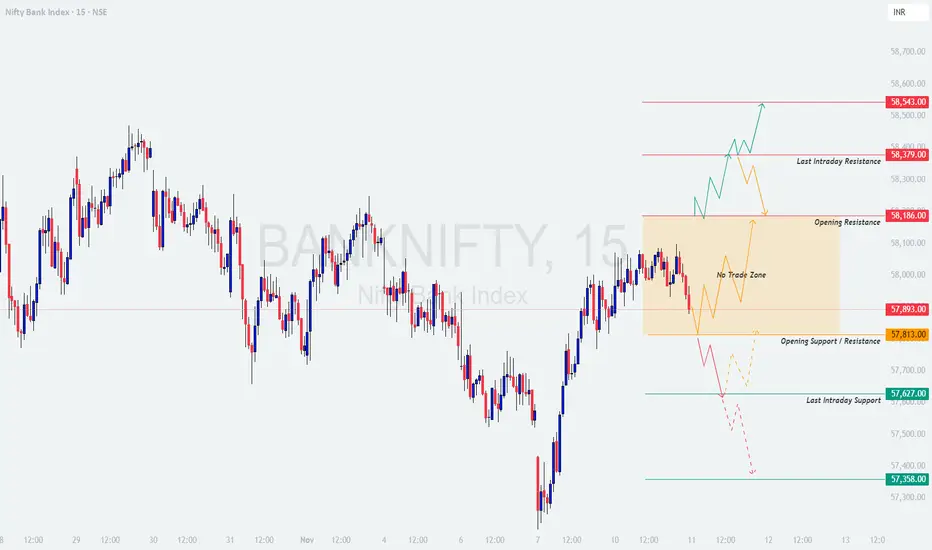
Bank Nifty closed near 57,893, sitting right in the middle of a No-Trade Zone (57,813 – 58,186). This range highlights a zone of indecision where both bulls and bears are currently fighting for control.
The price structure shows a potential breakout setup: a move beyond this zone could lead to a sharp intraday trend, while remaining within it may result in choppy sideways action. Key levels to track include Opening Resistance at 58,186 and Opening Support at 57,813.
Major resistance lies around 58,379 – 58,543, while supports are placed near 57,627 – 57,358. Tomorrow’s action will depend heavily on how price behaves around these breakout levels.
🟢 Scenario 1: GAP-UP Opening (200+ Points)
If Bank Nifty opens around or above 58,100 – 58,200, it will directly enter the upper part of the No-Trade Zone near the Opening Resistance. Bulls need a strong follow-through above 58,186 to confirm an upside continuation.
💡 Educational Note:
Gap-up openings near resistance often trap early buyers. Professionals wait for retests or volume confirmation before committing capital. A breakout that holds with clean price structure and rising volumes indicates institutional strength — that’s the kind of move worth trading.
🟧 Scenario 2: FLAT Opening (Within 57,813 – 58,186)
If Bank Nifty opens flat within this No-Trade Zone, expect early volatility and whipsaws. This range is not ideal for fresh entries until the index breaks out decisively on either side.
🧠 Educational Tip:
Flat openings demand patience. When markets open inside a range, both buyers and sellers test control before a trend emerges. Most early losses occur because traders act before confirmation. The best opportunities form after the market “shows its hand” — not before.
🔴 Scenario 3: GAP-DOWN Opening (200+ Points)
If Bank Nifty opens below 57,700, it will move near the lower boundary of the Opening Support Zone (57,813 – 57,627). This will be the key area to watch for buyer reactions.
📘 Educational Insight:
Gap-downs often test emotional control. While they can look bearish initially, many turn into reversal days once the selling pressure fades. The key is to avoid emotional reactions and let the first few candles reveal intent. A stable base near major support often becomes a turning point.
💼 RISK MANAGEMENT TIPS FOR OPTIONS TRADERS:
📈 SUMMARY:
📚 CONCLUSION:
Bank Nifty is at a key decision zone — 57,813 – 58,186 acts as the battleground between bulls and bears. A sustained breakout above 58,186 can trigger a strong momentum rally toward 58,543, while slipping below 57,813 could lead to a test of 57,627 – 57,358.
The first 30 minutes of price action will set the tone — respect those levels, trade with confirmation, and avoid emotional impulses.
📊 Remember: Great traders don’t predict the market; they prepare for every scenario.
⚠️ DISCLAIMER:
I am not a SEBI-registered analyst. The views and levels shared here are purely for educational purposes. Please do your own research or consult a certified financial advisor before making any trading or investment decisions.
(Timeframe Reference: 15-Min Chart)
Chart Summary:
Bank Nifty closed near 57,893, sitting right in the middle of a No-Trade Zone (57,813 – 58,186). This range highlights a zone of indecision where both bulls and bears are currently fighting for control.
The price structure shows a potential breakout setup: a move beyond this zone could lead to a sharp intraday trend, while remaining within it may result in choppy sideways action. Key levels to track include Opening Resistance at 58,186 and Opening Support at 57,813.
Major resistance lies around 58,379 – 58,543, while supports are placed near 57,627 – 57,358. Tomorrow’s action will depend heavily on how price behaves around these breakout levels.
🟢 Scenario 1: GAP-UP Opening (200+ Points)
If Bank Nifty opens around or above 58,100 – 58,200, it will directly enter the upper part of the No-Trade Zone near the Opening Resistance. Bulls need a strong follow-through above 58,186 to confirm an upside continuation.
- []If price sustains above 58,186 with bullish candle closings and volume expansion, an upward move toward 58,379 and 58,543 is likely.
[]However, if the index opens higher but faces rejection near 58,186, expect a pullback toward 57,893 – 57,813.
[]Ideal strategy: Wait for the first 15–30 minutes to settle. Enter only after a clear breakout retest above 58,186 to minimize risk of false moves.
[]Aggressive traders can trail stop-loss below 58,000 once the breakout sustains.
💡 Educational Note:
Gap-up openings near resistance often trap early buyers. Professionals wait for retests or volume confirmation before committing capital. A breakout that holds with clean price structure and rising volumes indicates institutional strength — that’s the kind of move worth trading.
🟧 Scenario 2: FLAT Opening (Within 57,813 – 58,186)
If Bank Nifty opens flat within this No-Trade Zone, expect early volatility and whipsaws. This range is not ideal for fresh entries until the index breaks out decisively on either side.
- []Avoid taking trades between 57,813 – 58,186 as price may fluctuate without direction.
[]If price breaks above 58,186 decisively with follow-through volume, targets open toward 58,379 – 58,543.
[]If price breaks below 57,813, expect weakness to extend toward 57,627 and possibly 57,358.
[]Wait for confirmation candles and volume expansion — sideways markets are known for fake breakouts and false triggers.
🧠 Educational Tip:
Flat openings demand patience. When markets open inside a range, both buyers and sellers test control before a trend emerges. Most early losses occur because traders act before confirmation. The best opportunities form after the market “shows its hand” — not before.
🔴 Scenario 3: GAP-DOWN Opening (200+ Points)
If Bank Nifty opens below 57,700, it will move near the lower boundary of the Opening Support Zone (57,813 – 57,627). This will be the key area to watch for buyer reactions.
- []If reversal patterns (like hammer, bullish engulfing, or double bottom) appear near 57,627 – 57,358, traders can look for a short-covering move toward 57,813 – 57,893.
[]If price breaks and sustains below 57,627 with heavy selling, weakness may extend toward 57,358 and possibly 57,200.
[]Avoid shorting immediately after a deep gap-down — wait for a pullback toward resistance for better entries and safer risk-reward setups.
[]Always observe how volume behaves near support — declining volume signals seller exhaustion, while strong red candles confirm continuation.
📘 Educational Insight:
Gap-downs often test emotional control. While they can look bearish initially, many turn into reversal days once the selling pressure fades. The key is to avoid emotional reactions and let the first few candles reveal intent. A stable base near major support often becomes a turning point.
💼 RISK MANAGEMENT TIPS FOR OPTIONS TRADERS:
- []Avoid buying options in the first 15 minutes — IV spikes post-open inflate premiums and cause quick time decay once volatility stabilizes.
[]Never risk more than 1–2% of your total capital on a single trade — survival in trading is about capital preservation.
[]Prefer ITM options for directional clarity; they offer smoother price behavior and less decay.
[]Trail stop-losses as soon as trades move 40–50 points in favor; protect profits without overexposure.
[]Avoid holding weekly options overnight unless you have a confirmed trend or hedge.
[]Always journal your trades — patterns of discipline are built from reflection, not reaction.
📈 SUMMARY:
- []🟧 No-Trade Zone: 57,813 – 58,186[]🟥 Resistance Zones: 58,379 / 58,543[]🟩 Support Zones: 57,627 / 57,358[]⚖️ Bias: Neutral-to-Bullish above 58,186 | Weakness below 57,813
📚 CONCLUSION:
Bank Nifty is at a key decision zone — 57,813 – 58,186 acts as the battleground between bulls and bears. A sustained breakout above 58,186 can trigger a strong momentum rally toward 58,543, while slipping below 57,813 could lead to a test of 57,627 – 57,358.
The first 30 minutes of price action will set the tone — respect those levels, trade with confirmation, and avoid emotional impulses.
📊 Remember: Great traders don’t predict the market; they prepare for every scenario.
⚠️ DISCLAIMER:
I am not a SEBI-registered analyst. The views and levels shared here are purely for educational purposes. Please do your own research or consult a certified financial advisor before making any trading or investment decisions.
Declinazione di responsabilità
Le informazioni e le pubblicazioni non sono intese come, e non costituiscono, consulenza o raccomandazioni finanziarie, di investimento, di trading o di altro tipo fornite o approvate da TradingView. Per ulteriori informazioni, consultare i Termini di utilizzo.
Declinazione di responsabilità
Le informazioni e le pubblicazioni non sono intese come, e non costituiscono, consulenza o raccomandazioni finanziarie, di investimento, di trading o di altro tipo fornite o approvate da TradingView. Per ulteriori informazioni, consultare i Termini di utilizzo.