\📊 BANKNIFTY TRADING PLAN – 25-Jun-2025\
📍 \Previous Close:\ 56,471.40
📏 \Gap Threshold Considered:\ 200+ points
📉 \Chart Basis:\ 15-min Timeframe
📌 \Volume Watch:\ 11M (important for confirmation near key levels)
---
\
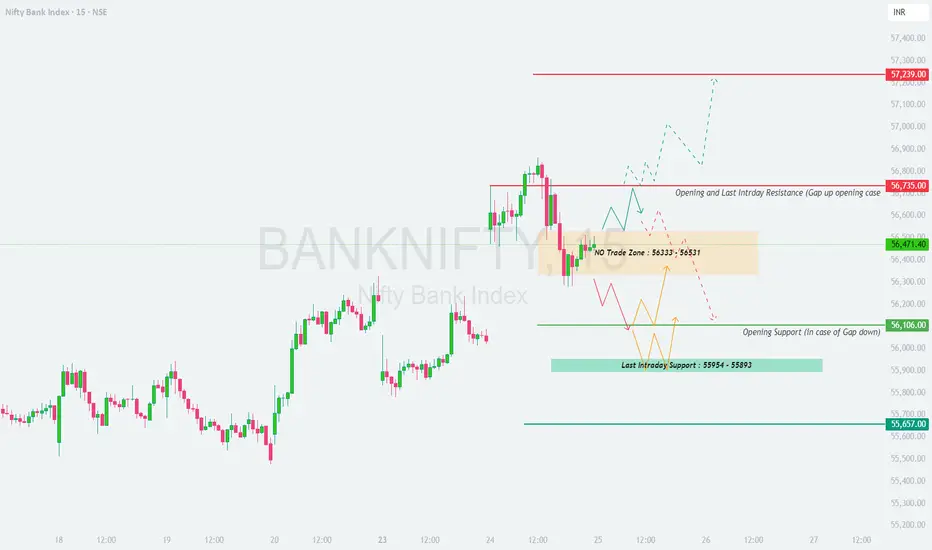
\[\*]\🚀 GAP-UP OPENING (Above 56,735):\
If BankNifty opens above \56,735\, it enters the prior \Last Intraday Resistance and Opening Resistance Zone\, which could act as a potential supply area. A further move toward \57,239\ (upper target) is possible only on sustained momentum.
✅ \Plan of Action:\
• Let the price stabilize for 15–30 minutes.
• A breakout above 56,735 with volume can attract follow-up buying.
• However, any hesitation near this zone may trigger intraday profit booking.
🎯 \Trade Setup:\
– Long above 56,735 (only if candle sustains with strength)
– Target: 56,900 / 57,239
– SL: 56,550
– Short opportunity arises if price reverses from 56,735 zone with bearish wick
📘 \Pro Tip:\ Use trailing SL when riding bullish momentum post-gap-up.
\[\*]\⚖️ FLAT OPENING (Between 56,333 – 56,531):\
This zone is marked as a \No Trade / Decision Zone\. The market might consolidate here before a decisive move either way.
✅ \Plan of Action:\
• Avoid early trades in this choppy zone.
• Watch for breakout above 56,531 = bullish signal
• Breakdown below 56,333 = early weakness
🎯 \Trade Setup:\
– Long above 56,531
– Short below 56,333
– SL: 40–60 pts depending on volatility
– Prefer breakout + retest pattern
📘 \Pro Tip:\ Patience pays here — don't get trapped in false moves inside the range.
\[\*]\📉 GAP-DOWN OPENING (Below 56,106):\
A gap-down below \56,106 (Opening Support)\ will shift the focus to the \Last Intraday Support Zone – 55,954 to 55,893\. If these supports fail, deeper correction may follow toward \55,657\.
✅ \Plan of Action:\
• Watch reaction at 55,954–55,893
• If price bounces here with volume, expect a quick intraday reversal trade
• A breakdown here confirms bearish grip toward 55,657
🎯 \Trade Setup:\
– Short below 55,893 with confirmation
– Target: 55,657
– SL: 56,050
– Long only if strong bullish reversal candle forms in green zone
📘 \Pro Tip:\ Avoid knife-catching. Let the support prove itself before going long.
---
\💼 OPTIONS RISK MANAGEMENT TIPS:\
✅ \1. Avoid buying options blindly on gap opens—wait for confirmation\
✅ \2. Use spreads in consolidation zones to minimize theta loss\
✅ \3. Track volume + price together; high IV = better premium opportunity\
✅ \4. Never risk more than 2% of capital in a single trade\
✅ \5. For index options, always define SL by candle close (15-min preferred)\
---
\📌 SUMMARY – KEY LEVELS TO WATCH:\
🔴 \Major Resistance:\ 57,239
🟥 \Opening & Intraday Resistance:\ 56,735
🟧 \No Trade Zone:\ 56,333 – 56,531
🟩 \Opening Support:\ 56,106
🟦 \Intraday Support Zone:\ 55,954 – 55,893
🟫 \Major Breakdown Level:\ 55,657
---
\🧭 CONCLUSION:\
• 🔼 \Above 56,735:\ Bullish if sustains — target 57,239
• ⏸ \Between 56,333–56,531:\ Avoid trading until breakout/breakdown
• 🔽 \Below 56,106:\ Weak bias — eyes on supports at 55,954 and 55,657
Stick to process, not prediction. Observe structure, manage risk, and stay adaptable. 🎯📊💼
---
\⚠️ DISCLAIMER:\
I am not a SEBI-registered analyst. This trading plan is shared for educational purposes only. Please consult your financial advisor before making any trading decisions. Always use strict risk management and stay disciplined. 📉📚🛡️
Declinazione di responsabilità
Le informazioni ed i contenuti pubblicati non costituiscono in alcun modo una sollecitazione ad investire o ad operare nei mercati finanziari. Non sono inoltre fornite o supportate da TradingView. Maggiori dettagli nelle Condizioni d'uso.
Declinazione di responsabilità
Le informazioni ed i contenuti pubblicati non costituiscono in alcun modo una sollecitazione ad investire o ad operare nei mercati finanziari. Non sono inoltre fornite o supportate da TradingView. Maggiori dettagli nelle Condizioni d'uso.