🔎 Higher Timeframe (4H) Outlook
Trend Bias: Clear bearish market structure — price rejected from supply around 54,000–54,100 and printed a strong bearish candle.
Key Supply Zones:
54,400–54,500 (FVG + strong supply)
54,000–54,100 (fresh supply that caused the last drop)
Demand Zone: 53,300–53,450 (green zone marked)
Observation: Price broke short-term bullish corrective channel, resuming bearish trend.
✅ Bias: Bearish on 4H until demand around 53,300–53,450 is tested.
⏱ 1H Chart Structure
Trendline Break: Price broke rising structure and retested supply.
FVG: Fresh bearish Fair Value Gap at 53,800–54,000.
EMA: Acting as dynamic resistance, price closed below.
Support: Immediate support around 53,600–53,650.
⚠️ If support breaks, expect a quick slide to 53,300 zone.
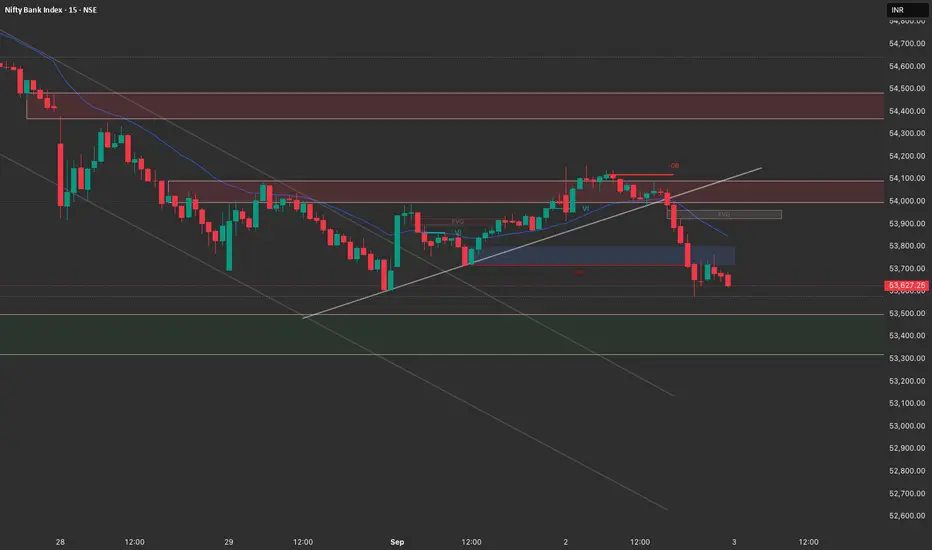
📉 15M Intraday Chart
Break of Structure (BOS): Confirmed at 53,800, marking bearish intent.
Order Blocks:
Bearish OB at 53,950–54,050 (likely short entry zone if retested).
Bullish OB around 53,350–53,400 (possible intraday bounce).
Liquidity: Sell-side liquidity resting below 53,500.
📝 Trade Plan for 3rd September
🔻 Bearish Scenarios
Short on Pullback to Supply
Entry: 53,900–54,000 (FVG zone)
Stop Loss: Above 54,150
Target 1: 53,600
Target 2: 53,350
Breakdown Play
If 53,600 support breaks with momentum, enter short.
SL: Above 53,800
Target: 53,300 demand zone
🔼 Bullish Scenarios (Low Probability)
Only valid if 53,300 demand zone holds with strong rejection.
Intraday bounce possible towards 53,700–53,800, but overall still a sell-on-rise market.
✅ Final Bias
Primary Bias: Bearish → Sell on rise.
Invalidation: If Bank Nifty sustains above 54,100, bearish view is invalidated.
Key Levels to Watch:
Resistance: 53,900–54,100
Support: 53,600 & 53,300–53,350
Trend Bias: Clear bearish market structure — price rejected from supply around 54,000–54,100 and printed a strong bearish candle.
Key Supply Zones:
54,400–54,500 (FVG + strong supply)
54,000–54,100 (fresh supply that caused the last drop)
Demand Zone: 53,300–53,450 (green zone marked)
Observation: Price broke short-term bullish corrective channel, resuming bearish trend.
✅ Bias: Bearish on 4H until demand around 53,300–53,450 is tested.
⏱ 1H Chart Structure
Trendline Break: Price broke rising structure and retested supply.
FVG: Fresh bearish Fair Value Gap at 53,800–54,000.
EMA: Acting as dynamic resistance, price closed below.
Support: Immediate support around 53,600–53,650.
⚠️ If support breaks, expect a quick slide to 53,300 zone.
📉 15M Intraday Chart
Break of Structure (BOS): Confirmed at 53,800, marking bearish intent.
Order Blocks:
Bearish OB at 53,950–54,050 (likely short entry zone if retested).
Bullish OB around 53,350–53,400 (possible intraday bounce).
Liquidity: Sell-side liquidity resting below 53,500.
📝 Trade Plan for 3rd September
🔻 Bearish Scenarios
Short on Pullback to Supply
Entry: 53,900–54,000 (FVG zone)
Stop Loss: Above 54,150
Target 1: 53,600
Target 2: 53,350
Breakdown Play
If 53,600 support breaks with momentum, enter short.
SL: Above 53,800
Target: 53,300 demand zone
🔼 Bullish Scenarios (Low Probability)
Only valid if 53,300 demand zone holds with strong rejection.
Intraday bounce possible towards 53,700–53,800, but overall still a sell-on-rise market.
✅ Final Bias
Primary Bias: Bearish → Sell on rise.
Invalidation: If Bank Nifty sustains above 54,100, bearish view is invalidated.
Key Levels to Watch:
Resistance: 53,900–54,100
Support: 53,600 & 53,300–53,350
Declinazione di responsabilità
Le informazioni ed i contenuti pubblicati non costituiscono in alcun modo una sollecitazione ad investire o ad operare nei mercati finanziari. Non sono inoltre fornite o supportate da TradingView. Maggiori dettagli nelle Condizioni d'uso.
Declinazione di responsabilità
Le informazioni ed i contenuti pubblicati non costituiscono in alcun modo una sollecitazione ad investire o ad operare nei mercati finanziari. Non sono inoltre fornite o supportate da TradingView. Maggiori dettagli nelle Condizioni d'uso.