Detailed Market Structure Breakdown
4-Hour Chart (Macro Trend)
Structure: The Bank Nifty is back in a Strong Bullish Momentum phase, recovering from the sharp sell-off last week (Oct 31, where it closed near the lows). The price has successfully climbed back into the steep ascending channel, confirming a strong retest and bounce from the 57,400 area (implied lower channel boundary).
Key Levels:
Major Supply (Resistance): 58,300 - 58,600. This area encompasses the recent swing high and the All-Time High of 58,577.50. A decisive breakout above 58,600 is critical for further upside.
Major Demand (Support): 57,800 - 58,000. This area, which includes the lower trendline of the current ascending channel and a prior FVG, is the must-hold zone for the short-term uptrend.
Outlook: The short-term bias is Strongly Bullish. The market is poised to challenge the ATH again.
1-Hour Chart (Intermediate View)
Structure: The 1H chart shows a clear Break of Structure (MSS) back to the upside, following the successful re-entry into the ascending channel. The price is trading strongly above the 9-period EMA.
Key Levels:
Immediate Resistance: 58,300 (Upper trendline of the immediate channel).
Immediate Support: 57,900 - 58,000 (Psychological mark and lower channel boundary).
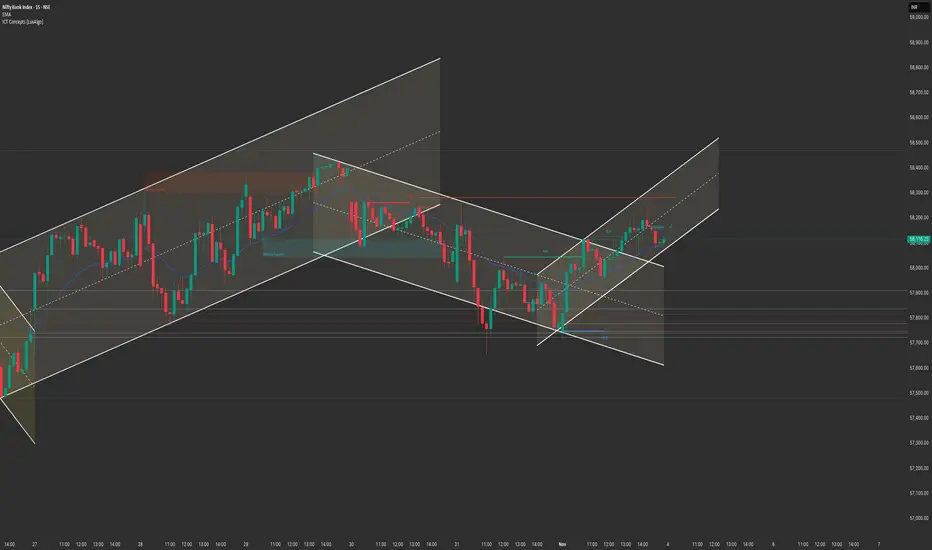
15-Minute Chart (Intraday View)
Structure: The 15M chart confirms the strong reversal. The price is trading at the upper end of the daily range, forming a small bullish continuation pattern right below the 58,300 resistance.
Key Levels:
Intraday Supply: 58,300.
Intraday Demand: 58,000.
Outlook: Aggressively Bullish.
📈 Structure Analysis & Trade Plan: 4th November
Market Outlook: Bank Nifty has shown massive strength, completely negating the sharp selling pressure from last week's end. The focus is on a breakout above the 58,300 resistance for an ATH retest.
Bullish Scenario (Primary Plan: Continuation)
Justification: The successful re-entry into the channel and the V-shaped recovery strongly favor continuation towards the ATH.
Entry: Long entry on a decisive break and 15-minute candle close above 58,300 (breaking the upper channel boundary). Alternatively, look for a dip entry near 58,000 - 58,100 (the immediate support zone).
Stop Loss (SL): Place a stop loss below 57,800 (below the lower channel trendline).
Targets:
T1: 58,577 (All-Time High retest).
T2: 59,000 (Psychological extension target).
Bearish Scenario (Counter-Trend/Reversal)
Justification: High-risk. Only valid if the market fails aggressively at the 58,300 mark.
Trigger: A sustained break and 1-hour close back below 57,800.
Entry: Short entry below 57,800.
Stop Loss (SL): Above 58,100.
Targets:
T1: 57,500 (Previous swing low/consolidation support).
T2: 57,200 (Major FVG support).
Key Levels for Observation:
Immediate Decision Point: 58,000 - 58,300 zone.
Bullish Confirmation: Sustained trade above 58,300.
Bearish Warning: A move below 57,800.
Line in the Sand: 57,800. Below this level, the short-term bullish bias is nullified.
4-Hour Chart (Macro Trend)
Structure: The Bank Nifty is back in a Strong Bullish Momentum phase, recovering from the sharp sell-off last week (Oct 31, where it closed near the lows). The price has successfully climbed back into the steep ascending channel, confirming a strong retest and bounce from the 57,400 area (implied lower channel boundary).
Key Levels:
Major Supply (Resistance): 58,300 - 58,600. This area encompasses the recent swing high and the All-Time High of 58,577.50. A decisive breakout above 58,600 is critical for further upside.
Major Demand (Support): 57,800 - 58,000. This area, which includes the lower trendline of the current ascending channel and a prior FVG, is the must-hold zone for the short-term uptrend.
Outlook: The short-term bias is Strongly Bullish. The market is poised to challenge the ATH again.
1-Hour Chart (Intermediate View)
Structure: The 1H chart shows a clear Break of Structure (MSS) back to the upside, following the successful re-entry into the ascending channel. The price is trading strongly above the 9-period EMA.
Key Levels:
Immediate Resistance: 58,300 (Upper trendline of the immediate channel).
Immediate Support: 57,900 - 58,000 (Psychological mark and lower channel boundary).
15-Minute Chart (Intraday View)
Structure: The 15M chart confirms the strong reversal. The price is trading at the upper end of the daily range, forming a small bullish continuation pattern right below the 58,300 resistance.
Key Levels:
Intraday Supply: 58,300.
Intraday Demand: 58,000.
Outlook: Aggressively Bullish.
📈 Structure Analysis & Trade Plan: 4th November
Market Outlook: Bank Nifty has shown massive strength, completely negating the sharp selling pressure from last week's end. The focus is on a breakout above the 58,300 resistance for an ATH retest.
Bullish Scenario (Primary Plan: Continuation)
Justification: The successful re-entry into the channel and the V-shaped recovery strongly favor continuation towards the ATH.
Entry: Long entry on a decisive break and 15-minute candle close above 58,300 (breaking the upper channel boundary). Alternatively, look for a dip entry near 58,000 - 58,100 (the immediate support zone).
Stop Loss (SL): Place a stop loss below 57,800 (below the lower channel trendline).
Targets:
T1: 58,577 (All-Time High retest).
T2: 59,000 (Psychological extension target).
Bearish Scenario (Counter-Trend/Reversal)
Justification: High-risk. Only valid if the market fails aggressively at the 58,300 mark.
Trigger: A sustained break and 1-hour close back below 57,800.
Entry: Short entry below 57,800.
Stop Loss (SL): Above 58,100.
Targets:
T1: 57,500 (Previous swing low/consolidation support).
T2: 57,200 (Major FVG support).
Key Levels for Observation:
Immediate Decision Point: 58,000 - 58,300 zone.
Bullish Confirmation: Sustained trade above 58,300.
Bearish Warning: A move below 57,800.
Line in the Sand: 57,800. Below this level, the short-term bullish bias is nullified.
Declinazione di responsabilità
Le informazioni e le pubblicazioni non sono intese come, e non costituiscono, consulenza o raccomandazioni finanziarie, di investimento, di trading o di altro tipo fornite o approvate da TradingView. Per ulteriori informazioni, consultare i Termini di utilizzo.
Declinazione di responsabilità
Le informazioni e le pubblicazioni non sono intese come, e non costituiscono, consulenza o raccomandazioni finanziarie, di investimento, di trading o di altro tipo fornite o approvate da TradingView. Per ulteriori informazioni, consultare i Termini di utilizzo.