BANK NIFTY TRADING PLAN – 05-Sep-2025
📌 Key Levels to Watch:
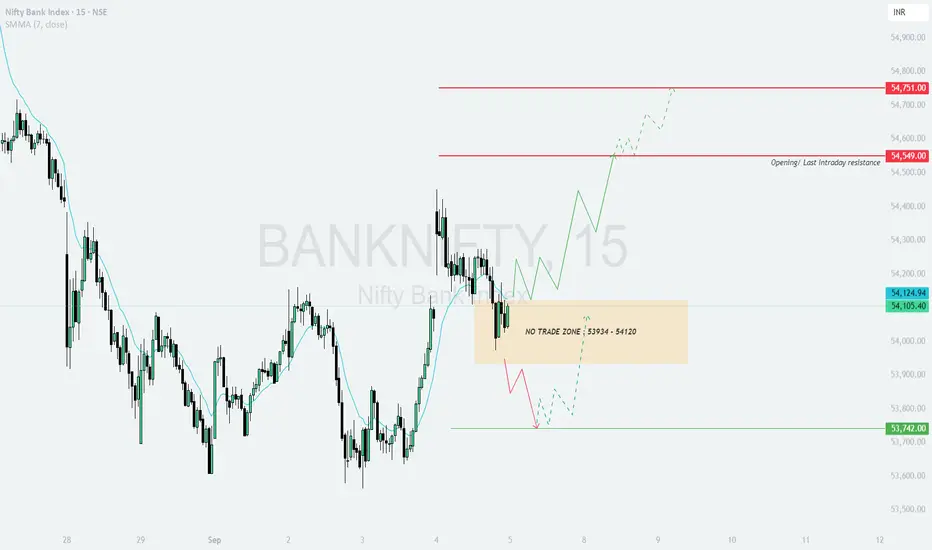
No Trade Zone: 53,934 – 54,120
Opening / Last Intraday Resistance: 54,549
Major Resistance: 54,751
Last Intraday Support: 53,742
The highlighted No Trade Zone (53,934 – 54,120) indicates indecision. Traders should wait for a breakout above or breakdown below this range to avoid getting trapped in false moves.
🔼 1. Gap-Up Opening (200+ points above 54,320)
If Bank Nifty opens with a strong gap-up above the No Trade Zone, it will directly test the resistance levels.
📌 Plan of Action:
👉 Educational Note: Gap-ups near resistance zones often witness volatility. Wait for the first 15–30 minutes to confirm strength before entering trades.
➖ 2. Flat Opening (Around 54,000 – 54,120)
A flat opening around the No Trade Zone suggests caution. The market may consolidate before choosing a direction.
📌 Plan of Action:
👉 Educational Note: Flat openings often provide directional clarity after consolidation. Avoid premature trades inside the No Trade Zone.
🔽 3. Gap-Down Opening (200+ points below 53,742)
If Bank Nifty opens below 53,742, sellers gain control, and downside momentum may accelerate.
📌 Plan of Action:
👉 Educational Note: Gap-downs are often emotional moves. Avoid chasing the fall blindly; wait for a clear pattern or retest before entering.
🛡️ Risk Management Tips for Options Traders
📌 Summary & Conclusion
🟢 Above 54,320 → Bullish bias with 54,549 and 54,751 as upside targets.
🟧 Flat Opening in No Trade Zone (53,934 – 54,120) → Wait for breakout before entry.
🔴 Below 53,742 → Bearish momentum, with potential for further downside.
⚠️ Critical Zone: 53,934 – 54,120 (No Trade Zone). Avoid entries here to reduce noise and trap risks.
⚠️ Disclaimer: I am not a SEBI-registered analyst. This analysis is for educational purposes only and not financial advice. Please consult your financial advisor before making any trading decisions.
📌 Key Levels to Watch:
No Trade Zone: 53,934 – 54,120
Opening / Last Intraday Resistance: 54,549
Major Resistance: 54,751
Last Intraday Support: 53,742
The highlighted No Trade Zone (53,934 – 54,120) indicates indecision. Traders should wait for a breakout above or breakdown below this range to avoid getting trapped in false moves.
🔼 1. Gap-Up Opening (200+ points above 54,320)
If Bank Nifty opens with a strong gap-up above the No Trade Zone, it will directly test the resistance levels.
📌 Plan of Action:
- [] Sustaining above 54,320 will strengthen the bullish bias.
[] First target to watch is 54,549, which is both an opening and last intraday resistance. - A clean breakout above 54,549 can fuel momentum towards 54,751, where profit booking may be expected.
👉 Educational Note: Gap-ups near resistance zones often witness volatility. Wait for the first 15–30 minutes to confirm strength before entering trades.
➖ 2. Flat Opening (Around 54,000 – 54,120)
A flat opening around the No Trade Zone suggests caution. The market may consolidate before choosing a direction.
📌 Plan of Action:
- [] If Bank Nifty sustains above 54,120, upside towards 54,549 becomes likely.
[] A breakout beyond 54,549 may extend towards 54,751. - Failure to hold 54,000 will drag price back into weakness towards 53,742.
👉 Educational Note: Flat openings often provide directional clarity after consolidation. Avoid premature trades inside the No Trade Zone.
🔽 3. Gap-Down Opening (200+ points below 53,742)
If Bank Nifty opens below 53,742, sellers gain control, and downside momentum may accelerate.
📌 Plan of Action:
- [] A gap-down below 53,742 opens room for further selling pressure.
[] Watch for quick intraday rebounds, but any recovery failing to cross back above 53,934 will remain weak. - Traders should be cautious of sharp volatility as panic selling can occur below major supports.
👉 Educational Note: Gap-downs are often emotional moves. Avoid chasing the fall blindly; wait for a clear pattern or retest before entering.
🛡️ Risk Management Tips for Options Traders
- [] Define a strict stop loss on an hourly close basis to avoid false breakouts.
[] Never risk more than 1–2% of your trading capital per trade.
[] Use straddle/strangle adjustments in case of sideways moves around the No Trade Zone.
[] Exit at partial targets – book half near first resistance/support and trail the rest. - Avoid overtrading during expiry week when premiums decay faster.
📌 Summary & Conclusion
🟢 Above 54,320 → Bullish bias with 54,549 and 54,751 as upside targets.
🟧 Flat Opening in No Trade Zone (53,934 – 54,120) → Wait for breakout before entry.
🔴 Below 53,742 → Bearish momentum, with potential for further downside.
⚠️ Critical Zone: 53,934 – 54,120 (No Trade Zone). Avoid entries here to reduce noise and trap risks.
⚠️ Disclaimer: I am not a SEBI-registered analyst. This analysis is for educational purposes only and not financial advice. Please consult your financial advisor before making any trading decisions.
Declinazione di responsabilità
Le informazioni ed i contenuti pubblicati non costituiscono in alcun modo una sollecitazione ad investire o ad operare nei mercati finanziari. Non sono inoltre fornite o supportate da TradingView. Maggiori dettagli nelle Condizioni d'uso.
Declinazione di responsabilità
Le informazioni ed i contenuti pubblicati non costituiscono in alcun modo una sollecitazione ad investire o ad operare nei mercati finanziari. Non sono inoltre fornite o supportate da TradingView. Maggiori dettagli nelle Condizioni d'uso.