📊 Bank Nifty Trading Plan – 23-May-2025
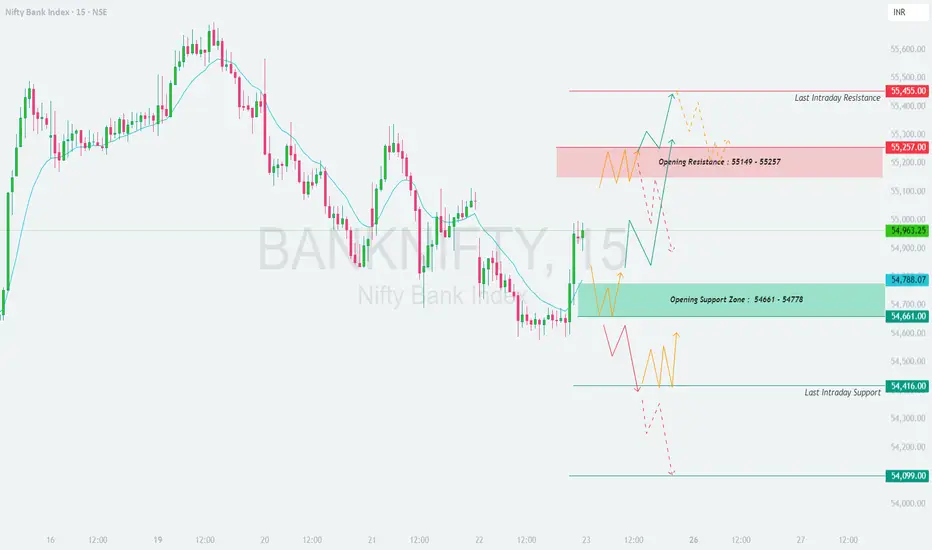
Chart Timeframe: 15 Min | Reference Spot Price: 54,963.25
Gap Opening Threshold: 200+ points
🛡️ Options Trading Risk Management Tips
✅ Use ATM or slightly ITM options for better price movement and less theta decay.
✅ Always trade with stop-loss based on spot levels, not option premiums.
✅ Avoid trading in No Trade Zones or during sideways market—wait for breakout or breakdown levels.
✅ Book partial profits near intermediate levels and trail SL to protect gains.
✅ Avoid overleveraging. Limit capital exposure to 1–2% per trade.
✅ Control emotions. Don’t revenge trade after stop-loss hits.
📌 Summary & Conclusion
🔹 Opening Resistance Zone: 55,149 – 55,257
🔹 Last Intraday Resistance: 55,455
🔹 Opening Support Zone: 54,661 – 54,778
🔹 Last Support Zone: 54,416
🔹 Deeper Support (Breakdown Only): 54,099
📈 Direction bias will be clear once price exits either support or resistance zone with volume.
⏱️ Wait for first 15–30 minutes before entering trades to avoid false breakouts.
🎯 High probability setups lie near breakout from resistance or breakdown from support.
⚠️ Disclaimer:
I am not a SEBI-registered analyst. This trading plan is shared only for educational and informational purposes. Please consult with a registered financial advisor before making any trading or investment decisions.
Chart Timeframe: 15 Min | Reference Spot Price: 54,963.25
Gap Opening Threshold: 200+ points
- 🚀 Gap-Up Opening (200+ Points Above Previous Close)
If Bank Nifty opens around 55,150+, it will enter directly into the Opening Resistance Zone: 55,149 – 55,257.
🟥 This zone is marked as a high supply area. Price tends to react with either consolidation or reversal due to trapped buyers/sellers from previous sessions.
✅ Plan of Action:
– Avoid aggressive longs right at the open in the resistance zone.
– Wait for a 15-min bullish candle to close above 55,257 for confirmation. This could open the upside to 55,455, the last intraday resistance.
– Bearish rejection patterns (like shooting star, bearish engulfing) in this zone can be used for sell-on-rise trades targeting back to 54,963 or even 54,788.
– Ideal stop loss should be just above 55,300–55,350 zone for short trades.
🎓 Educational Note: Zones like this often act as reversal points for intraday traders. Waiting for confirmation helps avoid traps.
- 📈 Flat Opening (within ±200 Points)
If Bank Nifty opens between 54,770 – 55,100, it opens near the mid-level or inside the indecisive No Trade Area around 54,963.
🟧 This area lacks clear directional bias. Choppiness, fakeouts, and whipsaws are common.
✅ Plan of Action:
– Stay out during the first 15–30 minutes. Observe trend formation.
– If price breaks and sustains above 55,149, it can give a clean move toward 55,257 – 55,455.
– If price slips below 54,788 and sustains, it may revisit Opening Support Zone: 54,661 – 54,778.
– Breakdown of 54,661 opens the gates for testing 54,416, the last intraday support.
🎓 Educational Note: Inside-range opens are often manipulated zones. Avoid premature entries and let price show strength or weakness beyond known key levels.
- 📉 Gap-Down Opening (200+ Points Below Previous Close)
If Bank Nifty opens near or below 54,750, we are entering the critical Opening Support Zone: 54,661 – 54,778.
🟩 This is a demand area where buyers previously supported the market.
✅ Plan of Action:
– Watch price behavior closely near 54,661.
– If bullish reversal patterns (like hammer, bullish engulfing) form and sustain, one can consider a reversal long trade with upside potential to 54,963 and above.
– However, a breakdown and 15-min candle close below 54,661 indicates seller dominance. In that case, target is Last Support: 54,416, and potentially 54,099 if the fall continues.
🎓 Educational Note: Don’t blindly buy dips in support zones. Confirm trend reversal before entering. Always have stop-loss in place.
🛡️ Options Trading Risk Management Tips
✅ Use ATM or slightly ITM options for better price movement and less theta decay.
✅ Always trade with stop-loss based on spot levels, not option premiums.
✅ Avoid trading in No Trade Zones or during sideways market—wait for breakout or breakdown levels.
✅ Book partial profits near intermediate levels and trail SL to protect gains.
✅ Avoid overleveraging. Limit capital exposure to 1–2% per trade.
✅ Control emotions. Don’t revenge trade after stop-loss hits.
📌 Summary & Conclusion
🔹 Opening Resistance Zone: 55,149 – 55,257
🔹 Last Intraday Resistance: 55,455
🔹 Opening Support Zone: 54,661 – 54,778
🔹 Last Support Zone: 54,416
🔹 Deeper Support (Breakdown Only): 54,099
📈 Direction bias will be clear once price exits either support or resistance zone with volume.
⏱️ Wait for first 15–30 minutes before entering trades to avoid false breakouts.
🎯 High probability setups lie near breakout from resistance or breakdown from support.
⚠️ Disclaimer:
I am not a SEBI-registered analyst. This trading plan is shared only for educational and informational purposes. Please consult with a registered financial advisor before making any trading or investment decisions.
Declinazione di responsabilità
Le informazioni e le pubblicazioni non sono intese come, e non costituiscono, consulenza o raccomandazioni finanziarie, di investimento, di trading o di altro tipo fornite o approvate da TradingView. Per ulteriori informazioni, consultare i Termini di utilizzo.
Declinazione di responsabilità
Le informazioni e le pubblicazioni non sono intese come, e non costituiscono, consulenza o raccomandazioni finanziarie, di investimento, di trading o di altro tipo fornite o approvate da TradingView. Per ulteriori informazioni, consultare i Termini di utilizzo.