📊 BANK NIFTY – Testing the Supply Zone After Strong Reversal ⚔️
Date: 28th Oct 2025
Spot Price: ₹58,271
🔹 Supports: 57,885 / 57,555 / 57,341
🔹 Resistances: 58,428 / 58,642 / 58,871
🔹 Intraday Demand Zones:
1️⃣ 57,629 – 57,576
2️⃣ 57,555 – 57,484
3️⃣ 57,341 – 57,300
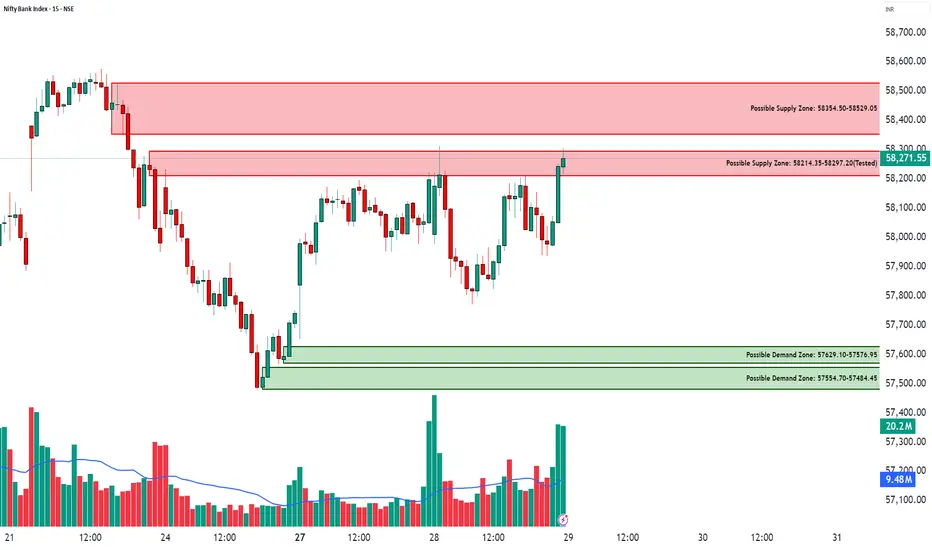
🔹 Supply Zones:
1️⃣ 58,214 – 58,297 (Tested)
2️⃣ 58,354 – 58,529
🔑 Key Highlights
Bank Nifty rebounded strongly from multiple demand zones near 57,600 with a clear volume spike.
Price has now reached the tested supply zone around 58,214–58,297, where profit booking or short build-up could appear.
ATR Dashboard (STWP Edition) shows volatility expansion — suggesting the next move will likely be decisive.
The upper supply belt (58,350–58,530) remains a crucial resistance for trend confirmation.
🎯 STWP Trade View
Bank Nifty is currently trapped between strong demand below and supply overhead, indicating a range setup.
Keep a close watch on dips back into the 57,600–57,800 demand pocket — those zones remain key buyer territories.
If the index breaks and sustains above 58,530, expect a momentum push toward 58,870+.
Conversely, rejection from the current supply could bring a short-term pullback.
💡 Learning Note
When price revisits a tested supply zone after a strong recovery, volume behavior becomes the key —
Declining volume = exhaustion
Expanding volume = breakout potential
Observing this shift early helps traders position themselves smartly before the move unfolds.
Final Outlook:
Momentum: Recovering, but supply pressure visible | Trend: Range-bound between 57,600–8,500|Risk: Neutral within range; breakout may shift bias | Volume: High during reversal — watch behavior at supply
________________________________________
________________________________________
⚠️ Disclosure & Disclaimer – Please Read Carefully
The information shared here is meant purely for learning and awareness. It is not a buy or sell recommendation and should not be taken as investment advice. I am not a SEBI-registered investment adviser, and all views expressed are based on personal study, chart patterns, and publicly available market data.
Trading—whether in stocks or options—carries risk. Markets can move unexpectedly, and losses can sometimes exceed the money you have invested. Past performance or past setups do not guarantee future results.
If you are a beginner, treat this as a guide to understand how the market works and practice on paper trades before risking real money. If you are experienced, always assess your own risk, position sizing, and strategy suitability before entering trades.
Consult a SEBI-registered financial adviser before making any real trading decision. By engaging with this content, you acknowledge full responsibility for your trades and investments.
Position Status: No active position in BANKNIFTY at the time of analysis.
Data Source: TradingView & NSE India (Past Chart Reference) (Historical levels)
💬 Found this useful?
🔼 Give this post a Boost to help more traders discover clean, structured learning.
✍️ Drop your thoughts, questions, or setups in the comments — let’s grow together!
🔁 Share with fellow traders and beginners to spread awareness.
👉 “If you liked this breakdown, follow for more clean, structured setups with discipline at the core.”
🚀 Stay Calm. Stay Clean. Trade With Patience.
Trade Smart | Learn Zones | Be Self-Reliant 📊
Date: 28th Oct 2025
Spot Price: ₹58,271
🔹 Supports: 57,885 / 57,555 / 57,341
🔹 Resistances: 58,428 / 58,642 / 58,871
🔹 Intraday Demand Zones:
1️⃣ 57,629 – 57,576
2️⃣ 57,555 – 57,484
3️⃣ 57,341 – 57,300
🔹 Supply Zones:
1️⃣ 58,214 – 58,297 (Tested)
2️⃣ 58,354 – 58,529
🔑 Key Highlights
Bank Nifty rebounded strongly from multiple demand zones near 57,600 with a clear volume spike.
Price has now reached the tested supply zone around 58,214–58,297, where profit booking or short build-up could appear.
ATR Dashboard (STWP Edition) shows volatility expansion — suggesting the next move will likely be decisive.
The upper supply belt (58,350–58,530) remains a crucial resistance for trend confirmation.
🎯 STWP Trade View
Bank Nifty is currently trapped between strong demand below and supply overhead, indicating a range setup.
Keep a close watch on dips back into the 57,600–57,800 demand pocket — those zones remain key buyer territories.
If the index breaks and sustains above 58,530, expect a momentum push toward 58,870+.
Conversely, rejection from the current supply could bring a short-term pullback.
💡 Learning Note
When price revisits a tested supply zone after a strong recovery, volume behavior becomes the key —
Declining volume = exhaustion
Expanding volume = breakout potential
Observing this shift early helps traders position themselves smartly before the move unfolds.
Final Outlook:
Momentum: Recovering, but supply pressure visible | Trend: Range-bound between 57,600–8,500|Risk: Neutral within range; breakout may shift bias | Volume: High during reversal — watch behavior at supply
________________________________________
________________________________________
⚠️ Disclosure & Disclaimer – Please Read Carefully
The information shared here is meant purely for learning and awareness. It is not a buy or sell recommendation and should not be taken as investment advice. I am not a SEBI-registered investment adviser, and all views expressed are based on personal study, chart patterns, and publicly available market data.
Trading—whether in stocks or options—carries risk. Markets can move unexpectedly, and losses can sometimes exceed the money you have invested. Past performance or past setups do not guarantee future results.
If you are a beginner, treat this as a guide to understand how the market works and practice on paper trades before risking real money. If you are experienced, always assess your own risk, position sizing, and strategy suitability before entering trades.
Consult a SEBI-registered financial adviser before making any real trading decision. By engaging with this content, you acknowledge full responsibility for your trades and investments.
Position Status: No active position in BANKNIFTY at the time of analysis.
Data Source: TradingView & NSE India (Past Chart Reference) (Historical levels)
💬 Found this useful?
🔼 Give this post a Boost to help more traders discover clean, structured learning.
✍️ Drop your thoughts, questions, or setups in the comments — let’s grow together!
🔁 Share with fellow traders and beginners to spread awareness.
👉 “If you liked this breakdown, follow for more clean, structured setups with discipline at the core.”
🚀 Stay Calm. Stay Clean. Trade With Patience.
Trade Smart | Learn Zones | Be Self-Reliant 📊
STWP | Mentor & Demand-Supply Specialist | Empowering traders through structured learning |
simpletradewithpatience.com
Community: chat.whatsapp.com/BEYz0tkqP0fJPBCWf59uel
wa.me/message/6IOPHGOXMGZ4N1
Educational Only
simpletradewithpatience.com
Community: chat.whatsapp.com/BEYz0tkqP0fJPBCWf59uel
wa.me/message/6IOPHGOXMGZ4N1
Educational Only
Declinazione di responsabilità
Le informazioni e le pubblicazioni non sono intese come, e non costituiscono, consulenza o raccomandazioni finanziarie, di investimento, di trading o di altro tipo fornite o approvate da TradingView. Per ulteriori informazioni, consultare i Termini di utilizzo.