BANK NIFTY TRADING PLAN – 16-Sep-2025
📊 Spot Price (Previous Close): 54,852
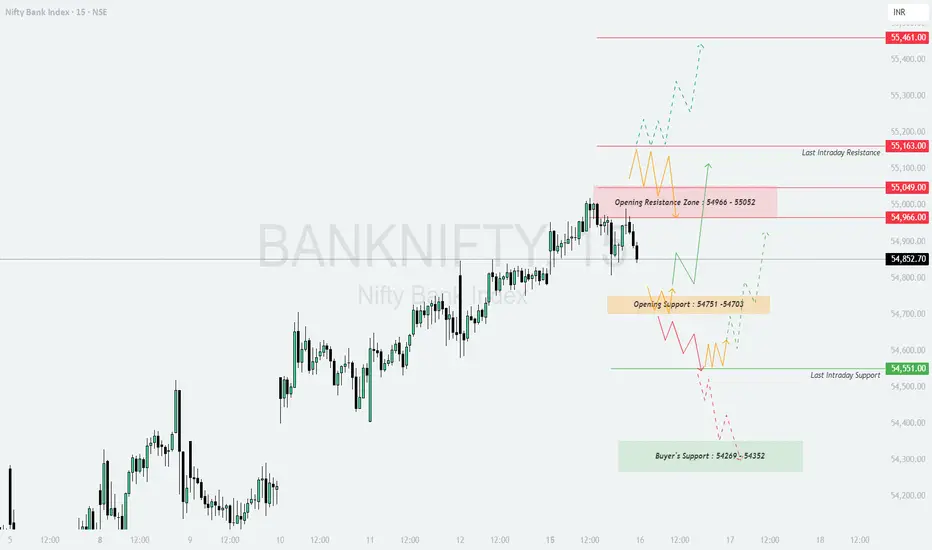
🔑 Key Levels from Chart:
Opening Resistance Zone: 54,966 – 55,052
Last Intraday Resistance: 55,163
Major Resistance: 55,461
Opening Support Zone: 54,751 – 54,703
Last Intraday Support: 54,551
Buyer’s Support Zone: 54,269 – 54,352
🔹 Scenario 1: Gap-Up Opening (200+ Points above 54,966)
📌 Educational Note: Gap-ups near resistance zones often face selling pressure. Always wait for confirmation candles before entering long trades.
🚨 Risk Tip: Instead of buying naked calls at higher premiums, prefer Bull Call Spreads (Buy ATM call + Sell OTM call) to reduce risk.
🔹 Scenario 2: Flat Opening (Between 54,703 – 54,966)
📌 Educational Note: Flat opens usually trap impatient traders. Observing the first 30 minutes helps in identifying genuine breakouts or breakdowns.
🚨 Risk Tip: Trade with small position sizing in flat zones. Scale up only after clear directional breakout.
🔹 Scenario 3: Gap-Down Opening (200+ Points below 54,551)
📌 Educational Note: Gap-downs near strong supports often create volatile intraday moves. Avoid panic selling; wait for confirmation before shorting.
🚨 Risk Tip: Use Bear Put Spreads (Buy ATM put + Sell lower strike put) instead of naked put buying to hedge against sudden short-covering rallies.
📝 Summary & Conclusion
Bullish above: 54,966 → Targets: 55,052 / 55,163 / 55,461
Neutral Zone: 54,703 – 54,966 → Choppy range, wait for breakout.
Bearish below: 54,551 → Downside targets: 54,352 / 54,269
📌 The market is currently at a crucial resistance zone. A clean breakout above 54,966 – 55,052 can extend bullish momentum, while a breakdown below 54,551 may shift trend to bearish.
💡 Options Tip: For directional trades, prefer ATM/ITM options for higher delta. In uncertain zones, adopt spreads (Bull Call / Bear Put) instead of naked options to minimize theta decay.
⚠️ Disclaimer: I am not a SEBI-registered analyst. This plan is prepared purely for educational purposes. Please do your own research or consult a financial advisor before making trading decisions.
📊 Spot Price (Previous Close): 54,852
🔑 Key Levels from Chart:
Opening Resistance Zone: 54,966 – 55,052
Last Intraday Resistance: 55,163
Major Resistance: 55,461
Opening Support Zone: 54,751 – 54,703
Last Intraday Support: 54,551
Buyer’s Support Zone: 54,269 – 54,352
🔹 Scenario 1: Gap-Up Opening (200+ Points above 54,966)
- [] If Bank Nifty opens with strength above 54,966, it directly tests the Opening Resistance Zone (54,966 – 55,052).
[] A strong breakout and hourly close above this zone may push prices toward 55,163, which is the last intraday resistance.
[] If bullish momentum continues, an extended move toward the 55,461 major resistance is possible.
[] On the flip side, rejection from 55,052 can cause a pullback toward 54,966, which then acts as support.
📌 Educational Note: Gap-ups near resistance zones often face selling pressure. Always wait for confirmation candles before entering long trades.
🚨 Risk Tip: Instead of buying naked calls at higher premiums, prefer Bull Call Spreads (Buy ATM call + Sell OTM call) to reduce risk.
🔹 Scenario 2: Flat Opening (Between 54,703 – 54,966)
- [] A flat open in this range suggests indecision, where both buyers and sellers will try to dominate.
[] A breakout above 54,966 can trigger bullish momentum toward 55,052 → 55,163, and possibly higher levels.
[] On the downside, if price slips below 54,751 – 54,703 support zone, it may test the 54,551 last intraday support.
[] Sustained trading in this zone without breakout may lead to sideways price action.
📌 Educational Note: Flat opens usually trap impatient traders. Observing the first 30 minutes helps in identifying genuine breakouts or breakdowns.
🚨 Risk Tip: Trade with small position sizing in flat zones. Scale up only after clear directional breakout.
🔹 Scenario 3: Gap-Down Opening (200+ Points below 54,551)
- [] A sharp gap-down below 54,551 will put immediate pressure on bulls.
[] If this level fails, prices may slide toward the Buyer’s Support Zone (54,269 – 54,352).
[] A breakdown below 54,269 can intensify selling and invite deeper corrections.
[] However, if Bank Nifty finds support near 54,352 – 54,269 and rebounds, a pullback rally toward 54,551 may occur.
📌 Educational Note: Gap-downs near strong supports often create volatile intraday moves. Avoid panic selling; wait for confirmation before shorting.
🚨 Risk Tip: Use Bear Put Spreads (Buy ATM put + Sell lower strike put) instead of naked put buying to hedge against sudden short-covering rallies.
📝 Summary & Conclusion
Bullish above: 54,966 → Targets: 55,052 / 55,163 / 55,461
Neutral Zone: 54,703 – 54,966 → Choppy range, wait for breakout.
Bearish below: 54,551 → Downside targets: 54,352 / 54,269
📌 The market is currently at a crucial resistance zone. A clean breakout above 54,966 – 55,052 can extend bullish momentum, while a breakdown below 54,551 may shift trend to bearish.
💡 Options Tip: For directional trades, prefer ATM/ITM options for higher delta. In uncertain zones, adopt spreads (Bull Call / Bear Put) instead of naked options to minimize theta decay.
⚠️ Disclaimer: I am not a SEBI-registered analyst. This plan is prepared purely for educational purposes. Please do your own research or consult a financial advisor before making trading decisions.
Declinazione di responsabilità
Le informazioni ed i contenuti pubblicati non costituiscono in alcun modo una sollecitazione ad investire o ad operare nei mercati finanziari. Non sono inoltre fornite o supportate da TradingView. Maggiori dettagli nelle Condizioni d'uso.
Declinazione di responsabilità
Le informazioni ed i contenuti pubblicati non costituiscono in alcun modo una sollecitazione ad investire o ad operare nei mercati finanziari. Non sono inoltre fornite o supportate da TradingView. Maggiori dettagli nelle Condizioni d'uso.