Detailed Market Structure Breakdown
4-Hour Chart (Macro Trend)
Structure: The Bank Nifty is still in a bullish uptrend, having rebounded sharply from the 54,250 base. However, the price has failed to sustain a move above 56,400. The current consolidation is taking place just below the major supply zone of 56,400 - 56,600, forming a symmetric triangle or pennant pattern.
Key Levels:
Major Supply (Resistance): 56,400 - 56,600. This is the critical overhead hurdle.
Major Demand (Support): 55,400 - 55,600. This area is the key immediate support, aligning with the prior swing low and FVG (Fair Value Gap) on the downside.
Outlook: The short-term bias is neutral-to-bullish. The consolidation is healthy but requires a strong catalyst to break the overhead resistance.
1-Hour Chart (Intermediate View)
Structure: The 1H chart shows the market is moving sideways after being rejected from the 56,400 high on Wednesday. It is trading between the lower boundary of the previous ascending channel and the upper boundary of a descending trendline, effectively squeezing the price.
Key Levels:
Immediate Resistance: 56,200 (The upper trendline of the corrective channel).
Immediate Support: 56,000 (The psychological level and the bottom of the current tight range).
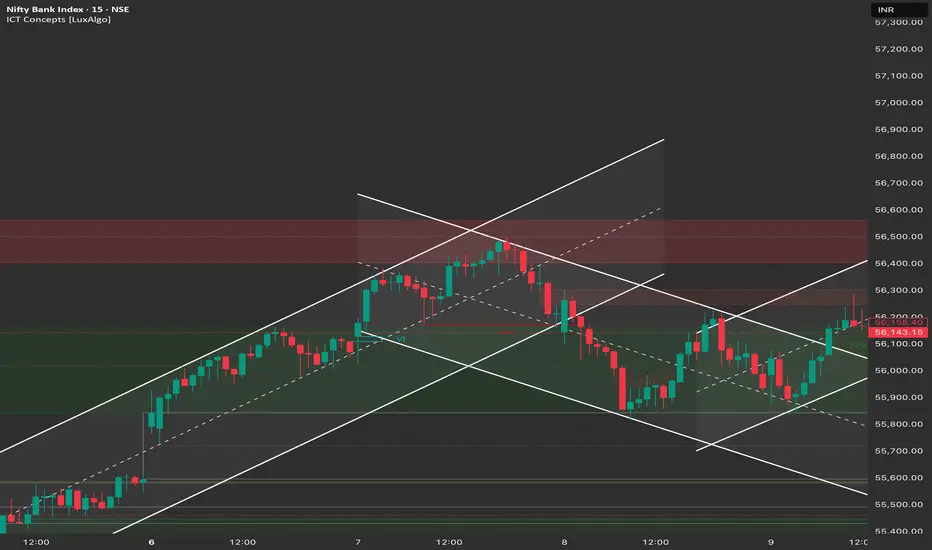
15-Minute Chart (Intraday View)
Structure: The 15M chart shows a very tight consolidation, with the price oscillating in a small range between 56,000 and 56,200. This suggests a period of accumulation/distribution is occurring, likely ahead of the open and in reaction to the TCS results.
Key Levels:
Intraday Supply: 56,200.
Intraday Demand: 56,000.
Outlook: Neutral. The market is waiting for a clear break of the 56,000 - 56,200 range.
📈 Trade Plan (Friday, 10th October)
Market Outlook: The Bank Nifty is in a tight consolidation, indicating a coil-up before a potentially sharp directional move. The market is influenced by the IT earnings season. The strategy is to trade the breakout.
Bullish Scenario (Primary Plan)
Justification: A continuation of the bullish recovery after a period of consolidation. A positive reaction to IT earnings or strong bank buying could fuel this.
Entry: Long entry on a decisive break and 15-minute candle close above 56,200.
Stop Loss (SL): Place a stop loss below 56,000 (below the immediate support).
Targets:
T1: 56,400 (Major supply zone).
T2: 56,600 (Extension target/Upper Order Block).
Bearish Scenario (Breakdown Plan)
Justification: The continuation of the correction due to global weakness or failure to break the supply zone.
Entry: Short entry on a decisive break and 15-minute candle close below 56,000.
Stop Loss (SL): Place a stop loss above 56,200.
Targets:
T1: 55,750 - 55,850 (Recent swing low/FVG).
T2: 55,400 (Major FVG support).
Key Levels for Observation:
Immediate Decision Point: The 56,000 - 56,200 consolidation zone.
Bullish Confirmation: A break and sustained move above 56,200.
Bearish Confirmation: A break and sustained move below 56,000.
Line in the Sand: 55,700. A break below this would confirm a return to the broader correction.
The [NIFTY & BANK NIFTY Analysis for Tomorrow | Stock Market Outlook | 08 October 2025, Wednesday] video offers analysis on the Bank Nifty trend and key trading levels which aligns with the current consolidation phase.
4-Hour Chart (Macro Trend)
Structure: The Bank Nifty is still in a bullish uptrend, having rebounded sharply from the 54,250 base. However, the price has failed to sustain a move above 56,400. The current consolidation is taking place just below the major supply zone of 56,400 - 56,600, forming a symmetric triangle or pennant pattern.
Key Levels:
Major Supply (Resistance): 56,400 - 56,600. This is the critical overhead hurdle.
Major Demand (Support): 55,400 - 55,600. This area is the key immediate support, aligning with the prior swing low and FVG (Fair Value Gap) on the downside.
Outlook: The short-term bias is neutral-to-bullish. The consolidation is healthy but requires a strong catalyst to break the overhead resistance.
1-Hour Chart (Intermediate View)
Structure: The 1H chart shows the market is moving sideways after being rejected from the 56,400 high on Wednesday. It is trading between the lower boundary of the previous ascending channel and the upper boundary of a descending trendline, effectively squeezing the price.
Key Levels:
Immediate Resistance: 56,200 (The upper trendline of the corrective channel).
Immediate Support: 56,000 (The psychological level and the bottom of the current tight range).
15-Minute Chart (Intraday View)
Structure: The 15M chart shows a very tight consolidation, with the price oscillating in a small range between 56,000 and 56,200. This suggests a period of accumulation/distribution is occurring, likely ahead of the open and in reaction to the TCS results.
Key Levels:
Intraday Supply: 56,200.
Intraday Demand: 56,000.
Outlook: Neutral. The market is waiting for a clear break of the 56,000 - 56,200 range.
📈 Trade Plan (Friday, 10th October)
Market Outlook: The Bank Nifty is in a tight consolidation, indicating a coil-up before a potentially sharp directional move. The market is influenced by the IT earnings season. The strategy is to trade the breakout.
Bullish Scenario (Primary Plan)
Justification: A continuation of the bullish recovery after a period of consolidation. A positive reaction to IT earnings or strong bank buying could fuel this.
Entry: Long entry on a decisive break and 15-minute candle close above 56,200.
Stop Loss (SL): Place a stop loss below 56,000 (below the immediate support).
Targets:
T1: 56,400 (Major supply zone).
T2: 56,600 (Extension target/Upper Order Block).
Bearish Scenario (Breakdown Plan)
Justification: The continuation of the correction due to global weakness or failure to break the supply zone.
Entry: Short entry on a decisive break and 15-minute candle close below 56,000.
Stop Loss (SL): Place a stop loss above 56,200.
Targets:
T1: 55,750 - 55,850 (Recent swing low/FVG).
T2: 55,400 (Major FVG support).
Key Levels for Observation:
Immediate Decision Point: The 56,000 - 56,200 consolidation zone.
Bullish Confirmation: A break and sustained move above 56,200.
Bearish Confirmation: A break and sustained move below 56,000.
Line in the Sand: 55,700. A break below this would confirm a return to the broader correction.
The [NIFTY & BANK NIFTY Analysis for Tomorrow | Stock Market Outlook | 08 October 2025, Wednesday] video offers analysis on the Bank Nifty trend and key trading levels which aligns with the current consolidation phase.
Declinazione di responsabilità
Le informazioni e le pubblicazioni non sono intese come, e non costituiscono, consulenza o raccomandazioni finanziarie, di investimento, di trading o di altro tipo fornite o approvate da TradingView. Per ulteriori informazioni, consultare i Termini di utilizzo.
Declinazione di responsabilità
Le informazioni e le pubblicazioni non sono intese come, e non costituiscono, consulenza o raccomandazioni finanziarie, di investimento, di trading o di altro tipo fornite o approvate da TradingView. Per ulteriori informazioni, consultare i Termini di utilizzo.