BANK NIFTY TRADING PLAN – 07-Oct-2025
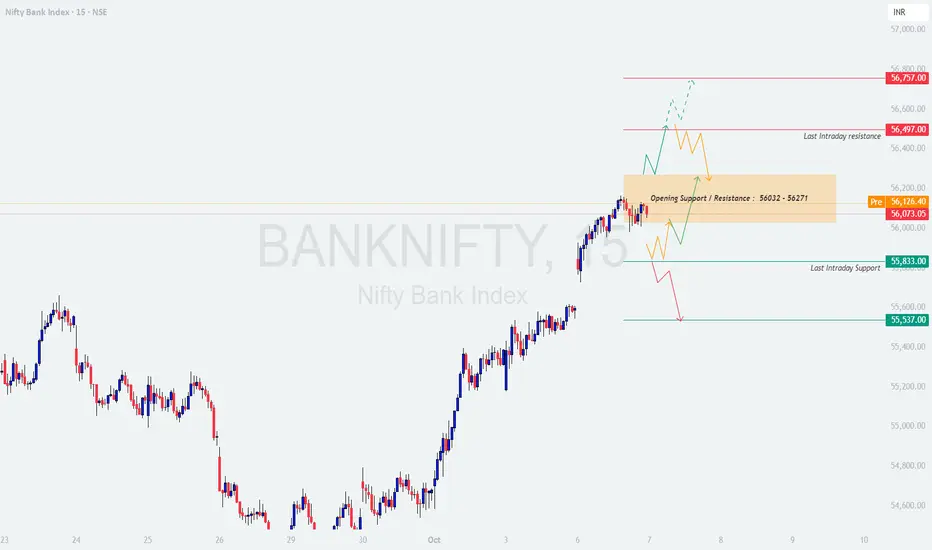
Bank Nifty closed at 56,073, showing slight consolidation after a strong rally in recent sessions. The index is currently hovering around a short-term decision zone, suggesting that the next directional move could emerge from the Opening Support/Resistance band (56,032 – 56,271). Tomorrow’s behavior around this area will be critical to define intraday bias.
📊 Key Technical Levels:
Opening Support / Resistance: 56,032 – 56,271
Last Intraday Resistance: 56,497
Major Resistance: 56,757
Last Intraday Support: 55,833
Major Support: 55,537
🚀 Scenario 1: Gap Up Opening (200+ points)
📘 Educational Note: Gap-ups near resistance often trigger early euphoria but also risk reversal traps. Always confirm a breakout with strong volume and closing strength.
⚖️ Scenario 2: Flat Opening (within ±200 points)
📘 Educational Note: Flat openings reflect indecision. Allow the market to establish direction through initial range expansion before positioning aggressively.
📉 Scenario 3: Gap Down Opening (200+ points)
📘 Educational Note: Gap-downs often create emotional selling. Instead of panic trades, look for reversal confirmations at major supports for high R:R setups.
🛡️ Risk Management Tips for Options Traders
📌 Summary & Conclusion
📈 The index remains in a short-term uptrend but faces immediate resistance at 56,497. A breakout could extend momentum, while a failure near resistance may trigger mild correction. Patience and disciplined entries near levels will be key to capturing tomorrow’s move effectively.
⚠️ Disclaimer: This analysis is for educational purposes only. I am not a SEBI-registered analyst. Please perform your own research or consult a financial advisor before taking any trading decisions.
Bank Nifty closed at 56,073, showing slight consolidation after a strong rally in recent sessions. The index is currently hovering around a short-term decision zone, suggesting that the next directional move could emerge from the Opening Support/Resistance band (56,032 – 56,271). Tomorrow’s behavior around this area will be critical to define intraday bias.
📊 Key Technical Levels:
Opening Support / Resistance: 56,032 – 56,271
Last Intraday Resistance: 56,497
Major Resistance: 56,757
Last Intraday Support: 55,833
Major Support: 55,537
🚀 Scenario 1: Gap Up Opening (200+ points)
- [] If Bank Nifty opens above 56,271, it will likely attempt to test the Last Intraday Resistance at 56,497.
[] Sustained trading above 56,497 may extend the bullish trend toward 56,757, marking a potential breakout zone for momentum traders.
[] However, if the index fails to hold above 56,271 and shows rejection candles near resistance, early profit booking can push prices back toward the 56,032 zone.
[] Traders should wait for a 15-min confirmation candle above 56,497 before entering long positions. Avoid chasing a gap-up blindly.
📘 Educational Note: Gap-ups near resistance often trigger early euphoria but also risk reversal traps. Always confirm a breakout with strong volume and closing strength.
⚖️ Scenario 2: Flat Opening (within ±200 points)
- [] A flat opening near 56,000 will keep the price action within the Opening Support/Resistance zone (56,032 – 56,271).
[] If the price sustains above 56,271, bulls could regain control and target 56,497.
[] On the contrary, a breakdown below 56,032 may invite selling pressure, dragging the index towards 55,833 initially.
[] The best strategy here is to let the first 30 minutes define direction — trade only on clear breakouts from this box range.
📘 Educational Note: Flat openings reflect indecision. Allow the market to establish direction through initial range expansion before positioning aggressively.
📉 Scenario 3: Gap Down Opening (200+ points)
- [] If Bank Nifty opens near 55,800 or below, it will test the Last Intraday Support at 55,833.
[] A decisive breakdown below 55,833 can extend weakness toward 55,537, which is a key bounce zone.
[] Conversely, if 55,833 holds firmly and bullish reversal candles form, expect a short-covering move toward 56,000+.
[] Avoid aggressive shorts near 55,537; this level can attract strong dip-buying interest.
📘 Educational Note: Gap-downs often create emotional selling. Instead of panic trades, look for reversal confirmations at major supports for high R:R setups.
🛡️ Risk Management Tips for Options Traders
- [] 🕒 Avoid trading in the first 15–30 minutes — allow volatility to settle.
[] 🛑 Always use hourly candle closes for SL validation instead of reacting to noise.
[] 💡 Prefer Bull Call / Bear Put Spreads near key levels to manage premium decay.
[] 💰 Follow a strict 1:2 Risk-Reward Ratio — never enter trades without clear R:R visibility.
[] 📉 Trail profits after every 100–150 points to protect gains in trending markets.
[] 🚫 Never risk more than 2%–3% of total capital on a single trade.
📌 Summary & Conclusion
- [] Bullish Bias: Above 56,497, upside targets 56,757 → 56,900.
[] Neutral Zone: Between 56,032 – 56,271, expect sideways volatility until breakout. - Bearish Bias: Below 55,833, weakness may extend towards 55,537.
📈 The index remains in a short-term uptrend but faces immediate resistance at 56,497. A breakout could extend momentum, while a failure near resistance may trigger mild correction. Patience and disciplined entries near levels will be key to capturing tomorrow’s move effectively.
⚠️ Disclaimer: This analysis is for educational purposes only. I am not a SEBI-registered analyst. Please perform your own research or consult a financial advisor before taking any trading decisions.
Declinazione di responsabilità
Le informazioni ed i contenuti pubblicati non costituiscono in alcun modo una sollecitazione ad investire o ad operare nei mercati finanziari. Non sono inoltre fornite o supportate da TradingView. Maggiori dettagli nelle Condizioni d'uso.
Declinazione di responsabilità
Le informazioni ed i contenuti pubblicati non costituiscono in alcun modo una sollecitazione ad investire o ad operare nei mercati finanziari. Non sono inoltre fornite o supportate da TradingView. Maggiori dettagli nelle Condizioni d'uso.