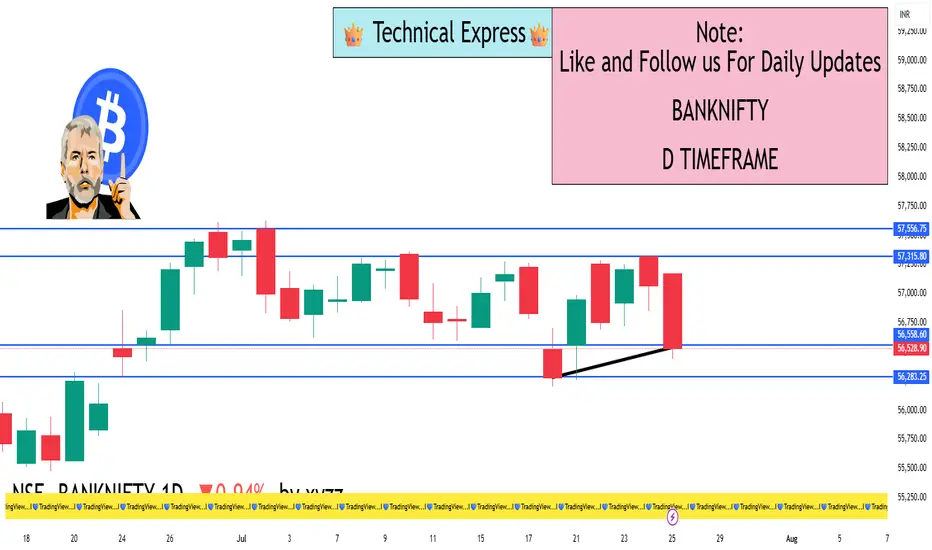
Closing Value: 56,528.90
Net Change: −537.15 points (−0.94%)
Opening Price: 57,034.40
Day’s High: 57,170.70
Day’s Low: 56,439.40
Trend: Bearish
📊 Technical Analysis
✅ Candle Pattern:
A strong bearish candle was formed.
Price opened higher but failed to sustain and closed near the day’s low — a sign of heavy intraday selling.
🔻 Support Zones:
56,400 – Immediate support (also the day's low)
56,000 – Psychological round number
55,750 – Medium-term support (from earlier price consolidation)
🔺 Resistance Zones:
56,800 – Near-term resistance
57,000 – Critical level; needs to be reclaimed for bullish reversal
57,300 – Stronger resistance zone based on recent highs
📈 Indicator Summary:
RSI (Relative Strength Index): Likely below 50, signaling weakening bullish momentum
MACD (Moving Average Convergence Divergence): Bearish crossover remains intact
Volume: Higher than average, suggesting institutional selling pressure
🧠 Market Sentiment:
Bearish sentiment prevailed across major banks including HDFC Bank, ICICI Bank, Axis Bank, Kotak Bank, and SBI
Pressure also visible in PSU banks (like PNB, Bank of Baroda, Canara Bank)
Overall market mood was risk-averse due to global uncertainty and potential interest rate impact
Foreign Institutional Investors (FIIs) continued their selling streak
Traders remain cautious ahead of upcoming quarterly bank results
✅ Conclusion:
Bank Nifty is currently in a short-term downtrend.
If 56,400 breaks decisively, it may head toward 56,000 and 55,750.
For bulls to regain strength, Bank Nifty must cross back above 57,000 with strong volume and momentum.
I built a Buy & Sell Signal Indicator with 85% accuracy.
📈 Get access via DM or
WhatsApp: wa.link/d997q0
Contact - +91 76782 40962
| Email: techncialexpress@gmail.com
| Script Coder | Trader | Investor | From India
📈 Get access via DM or
WhatsApp: wa.link/d997q0
Contact - +91 76782 40962
| Email: techncialexpress@gmail.com
| Script Coder | Trader | Investor | From India
Pubblicazioni correlate
Declinazione di responsabilità
Le informazioni e le pubblicazioni non sono intese come, e non costituiscono, consulenza o raccomandazioni finanziarie, di investimento, di trading o di altro tipo fornite o approvate da TradingView. Per ulteriori informazioni, consultare i Termini di utilizzo.