📊 Daily Support and Resistance Levels
Immediate Support: ₹1,204.27
Short-Term Support: ₹1,188.23
Key Resistance: ₹1,245.83
Short-Term Resistance: ₹1,233.07
🔁 Pivot Points (Daily)
Central Pivot Point (CPR): ₹1,217.03
Resistance Levels: ₹1,245.83, ₹1,261.87
Support Levels: ₹1,175.47, ₹1,188.23
📈 Technical Indicators
Relative Strength Index (RSI): Currently, the RSI is between 45 and 55, indicating a neutral market condition.
Moving Averages: The stock is trading near its short-term moving averages, suggesting a consolidation phase.
Volume: Moderate trading volume observed, indicating steady investor interest.
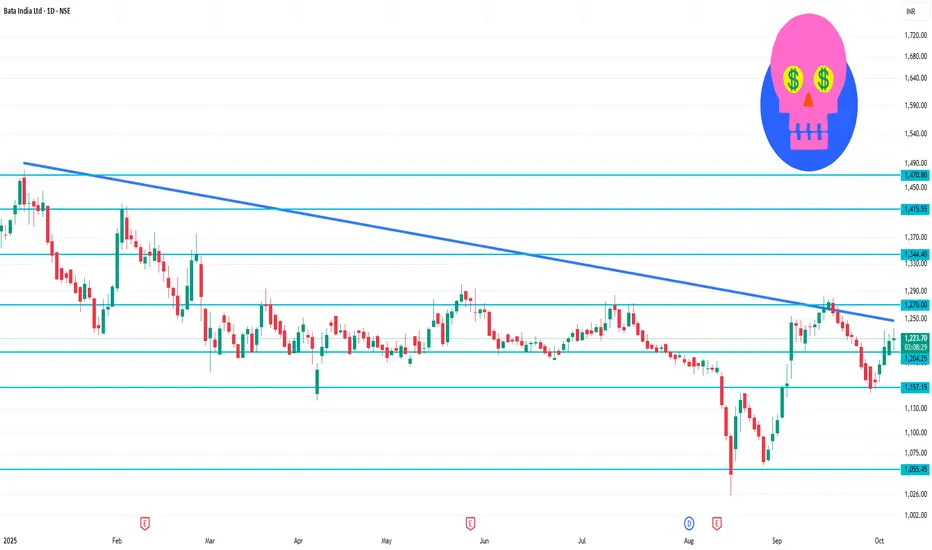
✅ Trade Insights
Bata India Ltd is currently in a neutral trend on the daily chart. A breakout above ₹1,245.83 could signal a bullish move towards ₹1,261.87. Conversely, a drop below ₹1,204.27 may indicate further downside.
Immediate Support: ₹1,204.27
Short-Term Support: ₹1,188.23
Key Resistance: ₹1,245.83
Short-Term Resistance: ₹1,233.07
🔁 Pivot Points (Daily)
Central Pivot Point (CPR): ₹1,217.03
Resistance Levels: ₹1,245.83, ₹1,261.87
Support Levels: ₹1,175.47, ₹1,188.23
📈 Technical Indicators
Relative Strength Index (RSI): Currently, the RSI is between 45 and 55, indicating a neutral market condition.
Moving Averages: The stock is trading near its short-term moving averages, suggesting a consolidation phase.
Volume: Moderate trading volume observed, indicating steady investor interest.
✅ Trade Insights
Bata India Ltd is currently in a neutral trend on the daily chart. A breakout above ₹1,245.83 could signal a bullish move towards ₹1,261.87. Conversely, a drop below ₹1,204.27 may indicate further downside.
Pubblicazioni correlate
Declinazione di responsabilità
Le informazioni ed i contenuti pubblicati non costituiscono in alcun modo una sollecitazione ad investire o ad operare nei mercati finanziari. Non sono inoltre fornite o supportate da TradingView. Maggiori dettagli nelle Condizioni d'uso.
Pubblicazioni correlate
Declinazione di responsabilità
Le informazioni ed i contenuti pubblicati non costituiscono in alcun modo una sollecitazione ad investire o ad operare nei mercati finanziari. Non sono inoltre fornite o supportate da TradingView. Maggiori dettagli nelle Condizioni d'uso.