Hello, traders!
Follow us to get the latest information quickly.
Have a great day.
-------------------------------------
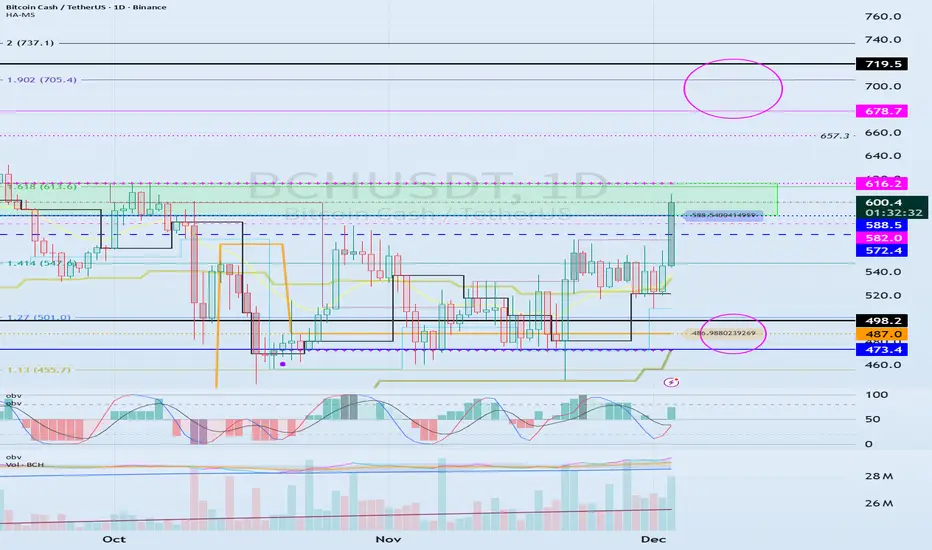
(BCHUSDT 1D chart)
The 1D chart is rising towards the HA-High ~ DOM (60) range, raising expectations for a bullish trend.
Accordingly, the key question is whether the 588.5-616.2 range can be supported and the price can rise.
If it rises, we should examine whether it can break above the 678.7-719.5 range, which is the range formed by the DOM (60) indicator on the 1M chart and the previous high.
To continue the uptrend by breaking above key points or ranges, the StochRSI, TC, and OBV indicators must show upward trends.
If possible,
- The StochRSI indicator should not have entered an overbought zone.
- The TC indicator should remain above zero.
- The OBV indicator should remain above the High Line.
Therefore, we should examine the movements of the StochRSI, TC, and OBV indicators when the price rises above the DOM (60) indicator.
If the StochRSI falls below 80, it's considered a stop loss, as further declines are likely.
-
Thank you for reading.
We wish you successful trading.
--------------------------------------------------
※ Follow X to check out the posts.
※ X를 팔로우하고 게시물을 확인하세요.
◆ t.me/readCryptoChannel
[HA-MS Indicator]
bit.ly/3YxHgvN
[OBV Indicator]
bit.ly/4dcyny3
※ X를 팔로우하고 게시물을 확인하세요.
◆ t.me/readCryptoChannel
[HA-MS Indicator]
bit.ly/3YxHgvN
[OBV Indicator]
bit.ly/4dcyny3
Pubblicazioni correlate
Declinazione di responsabilità
Le informazioni e le pubblicazioni non sono intese come, e non costituiscono, consulenza o raccomandazioni finanziarie, di investimento, di trading o di altro tipo fornite o approvate da TradingView. Per ulteriori informazioni, consultare i Termini di utilizzo.