#BCH/USDT
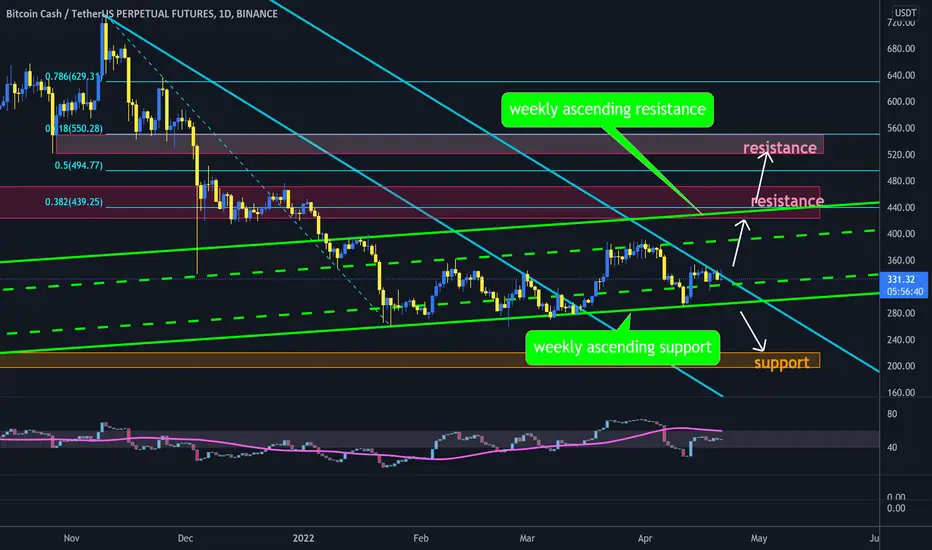
 BCH is trading between weekly ascending trend lines, also parallel descending trend line from all time high make resistance for price.
🐮 break out from descending resistance will increase price to ascending resistance that is the same with resistance zone around 0.382 fib level, and break out this zone will head up price to resistance zone between 0.5 and 0.618 fib levels.
🐻 rejection from descending resistance will drop price to ascending support that is so week because of so many touches and will drop more to long term support around $200.
Pubblicazioni correlate
Declinazione di responsabilità
Le informazioni ed i contenuti pubblicati non costituiscono in alcun modo una sollecitazione ad investire o ad operare nei mercati finanziari. Non sono inoltre fornite o supportate da TradingView. Maggiori dettagli nelle Condizioni d'uso.
Pubblicazioni correlate
Declinazione di responsabilità
Le informazioni ed i contenuti pubblicati non costituiscono in alcun modo una sollecitazione ad investire o ad operare nei mercati finanziari. Non sono inoltre fornite o supportate da TradingView. Maggiori dettagli nelle Condizioni d'uso.