📊 Daily Support & Resistance Levels
Support Levels: ₹409.67 (S2), ₹407.53 (S1)
Resistance Levels: ₹413.32 (Pivot), ₹416.97 (R2), ₹419.57 (R3)
The current price is trading above the central pivot point, indicating a potential continuation of the upward trend.
🔧 Technical Indicators
RSI (14): 73.1 — Approaching overbought territory, suggesting strong bullish momentum.
MACD: +2.23 — Positive and above the signal line, reinforcing the buy signal.
ADX (14): 43.07 — Indicates a strong trend with increasing momentum.
Stochastic RSI: 100 — Overbought, but can remain in this zone during strong trends.
Williams %R: -7.69 — In overbought territory, aligning with the bullish trend.
📈 Moving Averages
MA5: 416.19
MA10: 413.97
MA20: 410.59
MA50: 409.43
MA100: 408.19
MA200: 402.58
All moving averages are in a bullish alignment, supporting the upward momentum.
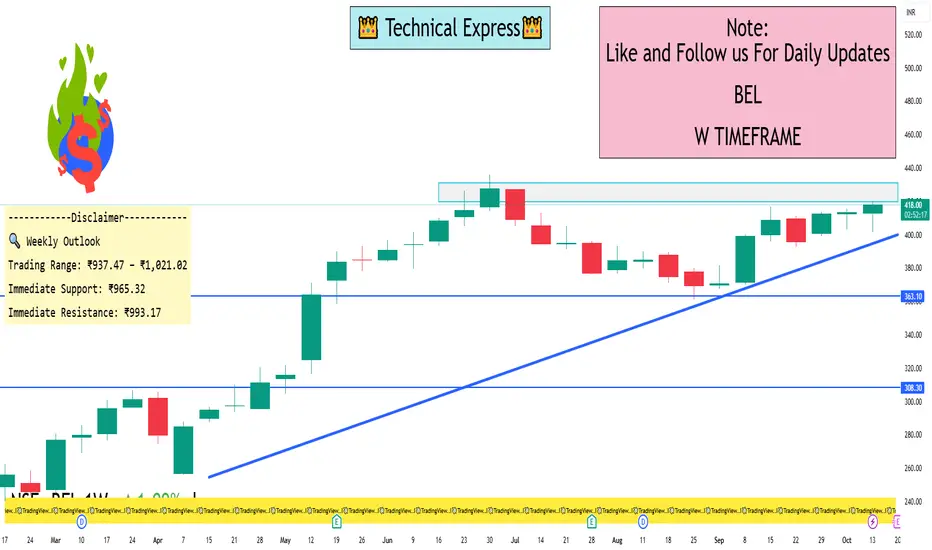
📌 Summary
BEL is currently exhibiting a strong bullish trend on the daily timeframe, with prices above key support and resistance levels. Technical indicators such as RSI, MACD, and ADX confirm the strength of the trend. Traders should monitor the price action around the resistance levels for potential breakout opportunities.
Support Levels: ₹409.67 (S2), ₹407.53 (S1)
Resistance Levels: ₹413.32 (Pivot), ₹416.97 (R2), ₹419.57 (R3)
The current price is trading above the central pivot point, indicating a potential continuation of the upward trend.
🔧 Technical Indicators
RSI (14): 73.1 — Approaching overbought territory, suggesting strong bullish momentum.
MACD: +2.23 — Positive and above the signal line, reinforcing the buy signal.
ADX (14): 43.07 — Indicates a strong trend with increasing momentum.
Stochastic RSI: 100 — Overbought, but can remain in this zone during strong trends.
Williams %R: -7.69 — In overbought territory, aligning with the bullish trend.
📈 Moving Averages
MA5: 416.19
MA10: 413.97
MA20: 410.59
MA50: 409.43
MA100: 408.19
MA200: 402.58
All moving averages are in a bullish alignment, supporting the upward momentum.
📌 Summary
BEL is currently exhibiting a strong bullish trend on the daily timeframe, with prices above key support and resistance levels. Technical indicators such as RSI, MACD, and ADX confirm the strength of the trend. Traders should monitor the price action around the resistance levels for potential breakout opportunities.
I built a Buy & Sell Signal Indicator with 85% accuracy.
📈 Get access via DM or
WhatsApp: wa.link/d997q0
Contact - +91 76782 40962
| Email: techncialexpress@gmail.com
| Script Coder | Trader | Investor | From India
📈 Get access via DM or
WhatsApp: wa.link/d997q0
Contact - +91 76782 40962
| Email: techncialexpress@gmail.com
| Script Coder | Trader | Investor | From India
Pubblicazioni correlate
Declinazione di responsabilità
Le informazioni e le pubblicazioni non sono intese come, e non costituiscono, consulenza o raccomandazioni finanziarie, di investimento, di trading o di altro tipo fornite o approvate da TradingView. Per ulteriori informazioni, consultare i Termini di utilizzo.