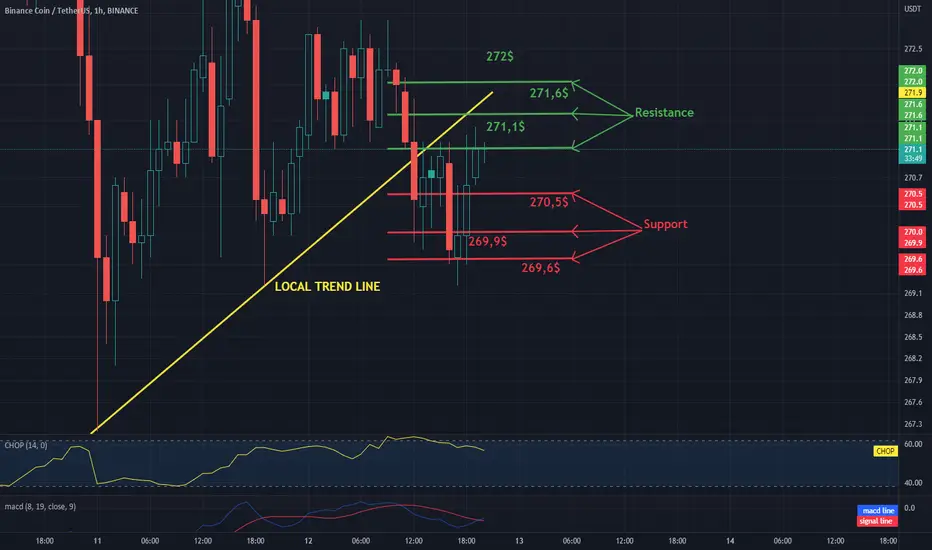
Hello everyone, let's take a look at the BNB to USDT chart over the 1 hour timeframe. As you can see, the price is moving below the local uptrend line.
Let's start with the designation of the support line and as you can see the first support in the near future is $ 270.5, if the support breaks down, the next support is $ 269.9 and $ 269.6.
Now let's move to the resistance line as you can see the first resistance is $ 271.1, if you can break it the next resistance will be $ 271.6 and $ 272.
Looking at the CHOP indicator, we can see that in the 1-hour interval we have a lot of energy, and the MACD indicator shows a local upward trend.
Declinazione di responsabilità
Le informazioni e le pubblicazioni non sono intese come, e non costituiscono, consulenza o raccomandazioni finanziarie, di investimento, di trading o di altro tipo fornite o approvate da TradingView. Per ulteriori informazioni, consultare i Termini di utilizzo.
Declinazione di responsabilità
Le informazioni e le pubblicazioni non sono intese come, e non costituiscono, consulenza o raccomandazioni finanziarie, di investimento, di trading o di altro tipo fornite o approvate da TradingView. Per ulteriori informazioni, consultare i Termini di utilizzo.