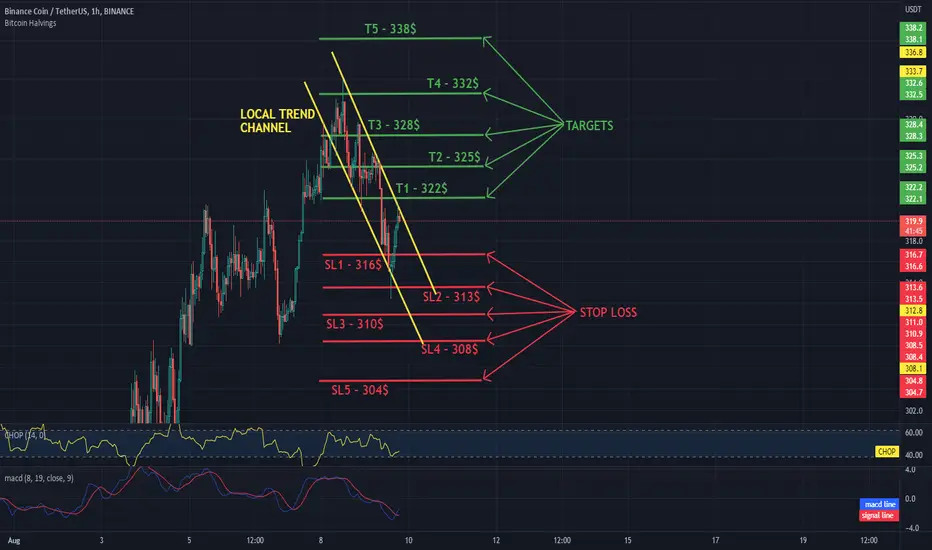
Hello everyone, let's take a look at the 1H BNB to USDT chart as you can see the price is trying to come out of the local downtrend channel.
Let's start by setting goals for the near future that we can consider:
T1 - $ 322
T2 - $ 325
T3 - $ 328
T4 - $ 332
and
T5 - $ 338
Now let's move on to the stop loss in case of further market declines:
SL1 - $ 316
SL2 - $ 313
SL3 - $ 310
SL4 - $ 308
and
SL5 - $ 304
Looking at the CHOP indicator, we can see that in the 1H range the energy slowly starts to rise, while the MACD indicator shows a local upward trend.
Declinazione di responsabilità
Le informazioni ed i contenuti pubblicati non costituiscono in alcun modo una sollecitazione ad investire o ad operare nei mercati finanziari. Non sono inoltre fornite o supportate da TradingView. Maggiori dettagli nelle Condizioni d'uso.
Declinazione di responsabilità
Le informazioni ed i contenuti pubblicati non costituiscono in alcun modo una sollecitazione ad investire o ad operare nei mercati finanziari. Non sono inoltre fornite o supportate da TradingView. Maggiori dettagli nelle Condizioni d'uso.