BTAF_ai | Elliott Wave & AI Algorithm Analysis
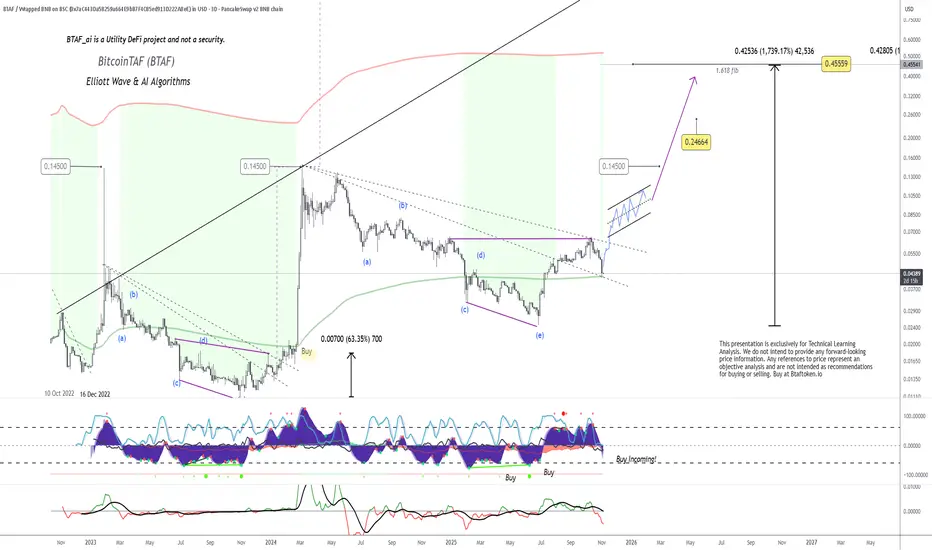
The chart illustrates BTAF’s current 3-Day structure with a strong Elliott Wave corrective completion (ABCDE) that mirrors the previous 2023 accumulation range. Each historical “Buy” signal shown on the oscillator preceded significant upside movements, often exceeding +600%.
We are again approaching a similar setup:
Current Price Zone: $0.04389 > this shows a BUY!
Wave Structure: Potential completion of Wave (e), signalling an early impulse phase.
Indicators: Multiple oscillators show bottoming conditions with “Buy Incoming!” confirmation.
Pattern: Breakout from the descending channel, forming an upward wedge, aligning with the next impulsive leg projection.
Targets (based on Fibonacci 1.618 extension):
Short-term: $0.14500
Mid-term: $0.24664
Long-term (1.618 fib): $0.425–$0.455 range (+1,700% zone)
Historically, the BTAF algorithmic patterns replicate after each deep corrective cycle, followed by steep exponential rallies. The structure now mirrors the March 2024 setup, which yielded a 63% initial surge before the full vertical run.
Observation:
If BTAF maintains support above the 200-MA and confirms the breakout above the wedge, this could initiate the next impulsive wave (1). Momentum indicators support early accumulation, and technical symmetry points to a sustained bullish cycle heading into 2026.
Disclaimer:
This presentation is exclusively for technical learning and algorithmic pattern recognition. It is not financial advice or a forecast. Always perform your own due diligence before trading
Marius Landman
Declinazione di responsabilità
Le informazioni ed i contenuti pubblicati non costituiscono in alcun modo una sollecitazione ad investire o ad operare nei mercati finanziari. Non sono inoltre fornite o supportate da TradingView. Maggiori dettagli nelle Condizioni d'uso.
Marius Landman
Declinazione di responsabilità
Le informazioni ed i contenuti pubblicati non costituiscono in alcun modo una sollecitazione ad investire o ad operare nei mercati finanziari. Non sono inoltre fornite o supportate da TradingView. Maggiori dettagli nelle Condizioni d'uso.