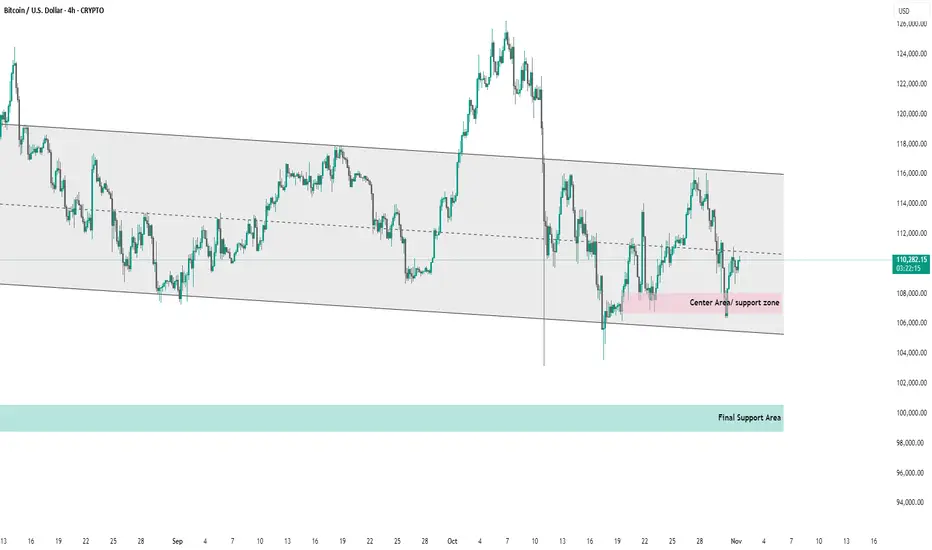
chart shows Bitcoin (BTC/USD) on the 4-hour timeframe within a descending channel pattern.
Key observations:
Channel Trend: BTC is trading inside a downward-sloping channel, indicating a medium-term bearish structure.
Current Price: Around $110,292.
Center Area / Support Zone: Highlighted in pink (~$107,000–$109,000) — acting as a short-term support or potential bounce region.
Final Support Area: Marked in green (~$98,000–$100,000) — a critical demand zone where strong buying interest may appear if price breaks below the current support.
Summary:
Bitcoin remains in a downward channel, consolidating near mid-support. A rebound from the pink zone could target the channel’s midline or upper boundary, while a break below $107,000 might lead to a test of the final support area near $100,000.
Pubblicazioni correlate
Declinazione di responsabilità
Le informazioni e le pubblicazioni non sono intese come, e non costituiscono, consulenza o raccomandazioni finanziarie, di investimento, di trading o di altro tipo fornite o approvate da TradingView. Per ulteriori informazioni, consultare i Termini di utilizzo.