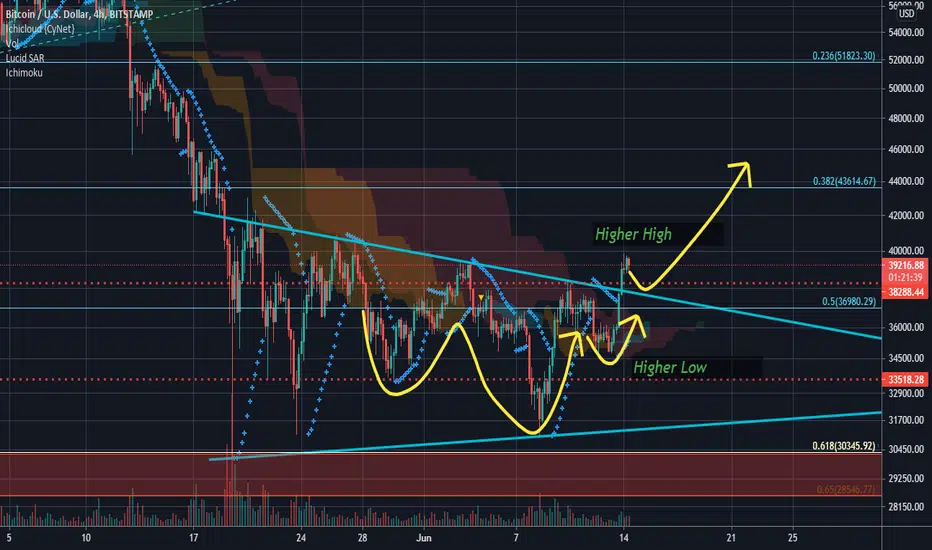
Higher low and higher high set on the 4 hrly.
Wait for retest of the top of the triangle as support for confirmation.
BTC had already retested the 61.8% Fib retracement level at ~30k USD.
Next level to look out for is the 38.2% Fib retracement level (@ ~43.6k USD), followed by the 23.6% Fib retracement level (@ ~51.8k USD).
Continued analysis from:

RSI and Stoch(RSI) regular bullish divergence on the daily.

MACD indicators bullish on the daily.

MA lines legend:
Red = 21 EMA
Green = 50 SMA
Thick Orange = 200 SMA
Thin Orange = 200 VWMA
Wait for retest of the top of the triangle as support for confirmation.
BTC had already retested the 61.8% Fib retracement level at ~30k USD.
Next level to look out for is the 38.2% Fib retracement level (@ ~43.6k USD), followed by the 23.6% Fib retracement level (@ ~51.8k USD).
Continued analysis from:
RSI and Stoch(RSI) regular bullish divergence on the daily.
MACD indicators bullish on the daily.
MA lines legend:
Red = 21 EMA
Green = 50 SMA
Thick Orange = 200 SMA
Thin Orange = 200 VWMA
Nota
Daily-close confirmation. No volume confirmation yet.However the consolidation exhibited dominant accumulation-like characteristic/patterns on the lower time frames.
Nota
6hrly Chart:Nota
Caution Death cross on the daily looming:MA crosses are lagging indicators, however it being imminent will provide some downward pressure. However the impending death cross may also catalyze a short-squeeze bounce, as excessive shorts builds up in anticipation of the event..
Nota
Nota
Bouncing off support:Nota
Declinazione di responsabilità
Le informazioni ed i contenuti pubblicati non costituiscono in alcun modo una sollecitazione ad investire o ad operare nei mercati finanziari. Non sono inoltre fornite o supportate da TradingView. Maggiori dettagli nelle Condizioni d'uso.
Declinazione di responsabilità
Le informazioni ed i contenuti pubblicati non costituiscono in alcun modo una sollecitazione ad investire o ad operare nei mercati finanziari. Non sono inoltre fornite o supportate da TradingView. Maggiori dettagli nelle Condizioni d'uso.