BTC/USD chart drawn support/resistance levels and target zones. Let’s break it down:
📉 Current Situation
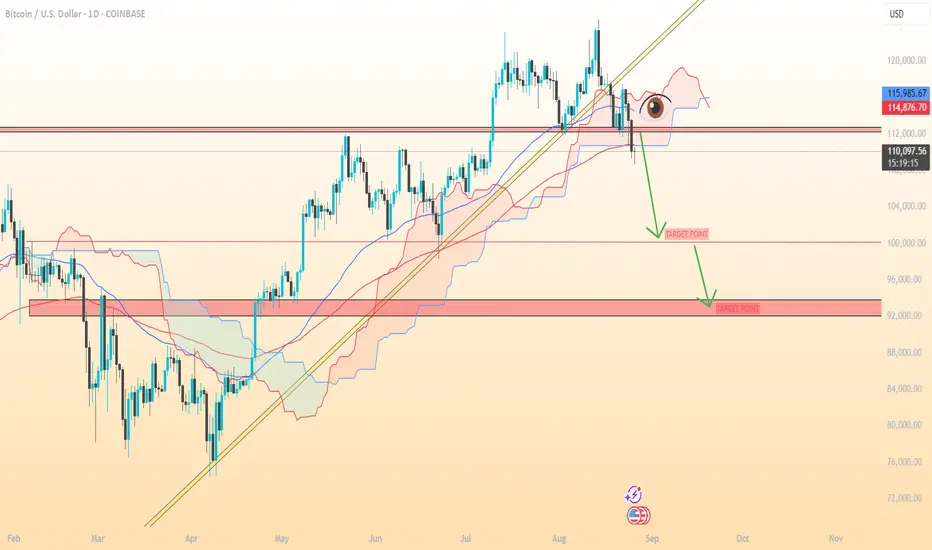
Price is around $110,051.
It has broken below a trendline and the Ichimoku cloud, suggesting bearish momentum.
The my chart shows two potential downside target points.
🎯 Target Levels (as per your chart)
1. First Target Zone: Around $100,000 – $102,000
(Marked by the first horizontal red zone, likely a strong support level).
2. Second Target Zone: Around $92,000 – $94,000
(The larger red zone further below, which looks like a major support and final bearish target).
⚠ Notes
These targets assume the bearish trend continues without strong reversal signals.
If BTC bounces back above $114,000 – $116,000, it may invalidate the bearish targets.
Always use stop-loss risk management since BTC can move sharply.
📉 Current Situation
Price is around $110,051.
It has broken below a trendline and the Ichimoku cloud, suggesting bearish momentum.
The my chart shows two potential downside target points.
🎯 Target Levels (as per your chart)
1. First Target Zone: Around $100,000 – $102,000
(Marked by the first horizontal red zone, likely a strong support level).
2. Second Target Zone: Around $92,000 – $94,000
(The larger red zone further below, which looks like a major support and final bearish target).
⚠ Notes
These targets assume the bearish trend continues without strong reversal signals.
If BTC bounces back above $114,000 – $116,000, it may invalidate the bearish targets.
Always use stop-loss risk management since BTC can move sharply.
Trade attivo
trade active📲 Join telegram channel free ..
t.me/+yJ2-qfkocRg1NDlk
Forex, Gold & Crypto Signals with detailed analysis & get consistent results..
t.me/XauusdGlobalSignal17
Gold Signal's with proper TP & SL for high profit opportunities..
t.me/+yJ2-qfkocRg1NDlk
Forex, Gold & Crypto Signals with detailed analysis & get consistent results..
t.me/XauusdGlobalSignal17
Gold Signal's with proper TP & SL for high profit opportunities..
Pubblicazioni correlate
Declinazione di responsabilità
Le informazioni ed i contenuti pubblicati non costituiscono in alcun modo una sollecitazione ad investire o ad operare nei mercati finanziari. Non sono inoltre fornite o supportate da TradingView. Maggiori dettagli nelle Condizioni d'uso.
📲 Join telegram channel free ..
t.me/+yJ2-qfkocRg1NDlk
Forex, Gold & Crypto Signals with detailed analysis & get consistent results..
t.me/XauusdGlobalSignal17
Gold Signal's with proper TP & SL for high profit opportunities..
t.me/+yJ2-qfkocRg1NDlk
Forex, Gold & Crypto Signals with detailed analysis & get consistent results..
t.me/XauusdGlobalSignal17
Gold Signal's with proper TP & SL for high profit opportunities..
Pubblicazioni correlate
Declinazione di responsabilità
Le informazioni ed i contenuti pubblicati non costituiscono in alcun modo una sollecitazione ad investire o ad operare nei mercati finanziari. Non sono inoltre fornite o supportate da TradingView. Maggiori dettagli nelle Condizioni d'uso.