Bitcoin (BTC) Analysis – Daily Chart
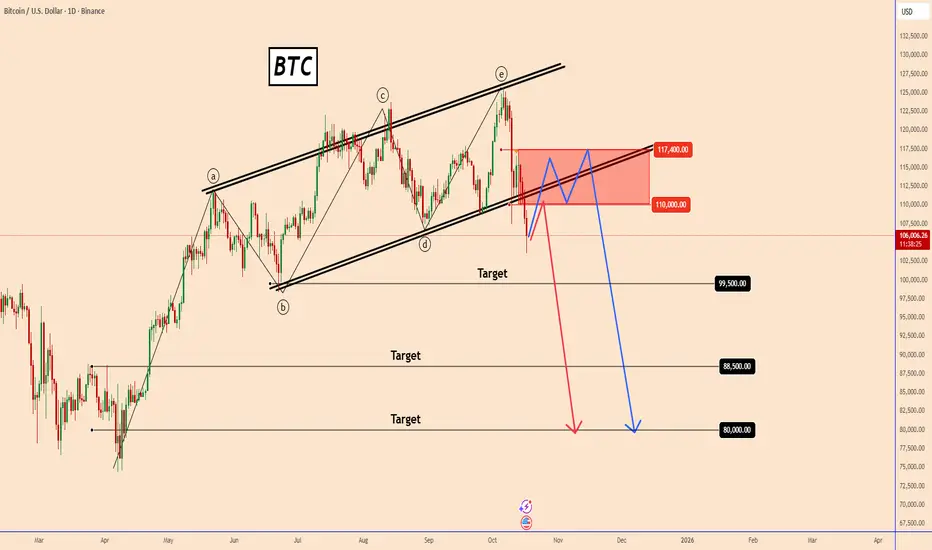
Bitcoin has broken below the ascending channel that has held for several months. This breakdown indicates a possible shift in momentum from bullish to bearish.
At the moment, the price is trading around $105,900, with resistance seen near $110,000 and $117,400. As long as BTC stays below these levels, the bias remains bearish.
If the price continues to fall, the next potential downside targets are around $99,500, $88,500, and $80,000.
However, if Bitcoin manages to recover and close back above $110,000, it could re-enter the previous range and attempt to retest the upper resistance area near $117,400.
The dynamics of change have been very high recently, so anything is possible.
You may find more details in the chart!
Thank you and Good Luck!
❤️PS: Please support with a like or comment if you find this analysis useful for your trading day❤️
✅MY FREE Signals Channel
t.me/TradingPuzzles
✅Personal Telegram
t.me/KlejdiCuni
✅Suggested News Channel
t.me/ForexNewsNavigator_Official
t.me/TradingPuzzles
✅Personal Telegram
t.me/KlejdiCuni
✅Suggested News Channel
t.me/ForexNewsNavigator_Official
Declinazione di responsabilità
Le informazioni ed i contenuti pubblicati non costituiscono in alcun modo una sollecitazione ad investire o ad operare nei mercati finanziari. Non sono inoltre fornite o supportate da TradingView. Maggiori dettagli nelle Condizioni d'uso.