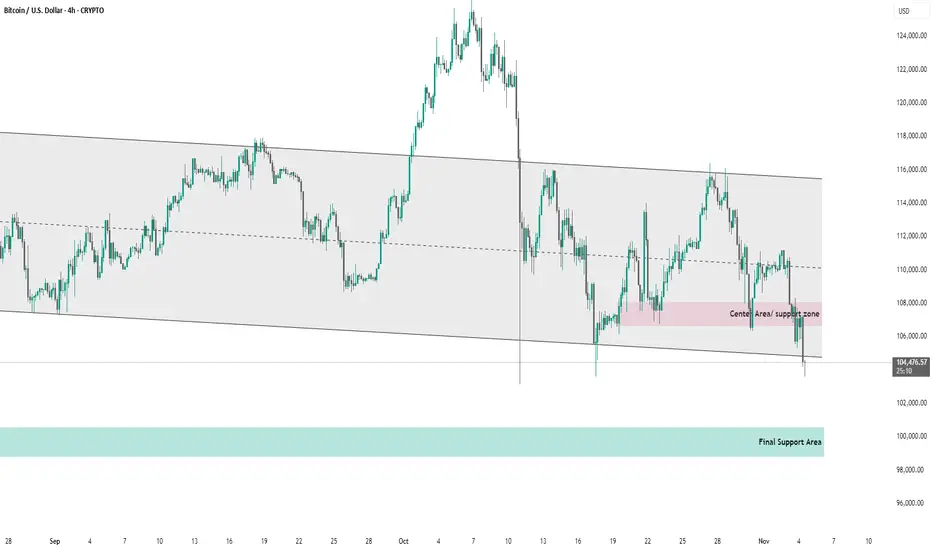
This chart shows Bitcoin’s (BTC/USD) 4-hour price movement within a descending channel.
Key observations:
Channel Trend: The price has been respecting a downward-sloping parallel channel, indicating a medium-term bearish trend.
Center Area / Support Zone: Around the $106,000 level (highlighted in pink), previously acted as support but has now been broken.
Current Price: BTC is trading near $104,369, just below the lower boundary of the channel — suggesting potential further downside.
Final Support Area: The next significant support lies around the $99,000–$100,000 region (highlighted in green).
Summary:
Bitcoin is currently testing the lower channel boundary. A confirmed breakdown below this zone could push the price toward the final support area, while a rebound could indicate a short-term recovery back into the channel.
Trade attivo
My analysis supply is finished herePubblicazioni correlate
Declinazione di responsabilità
Le informazioni e le pubblicazioni non sono intese come, e non costituiscono, consulenza o raccomandazioni finanziarie, di investimento, di trading o di altro tipo fornite o approvate da TradingView. Per ulteriori informazioni, consultare i Termini di utilizzo.
Pubblicazioni correlate
Declinazione di responsabilità
Le informazioni e le pubblicazioni non sono intese come, e non costituiscono, consulenza o raccomandazioni finanziarie, di investimento, di trading o di altro tipo fornite o approvate da TradingView. Per ulteriori informazioni, consultare i Termini di utilizzo.