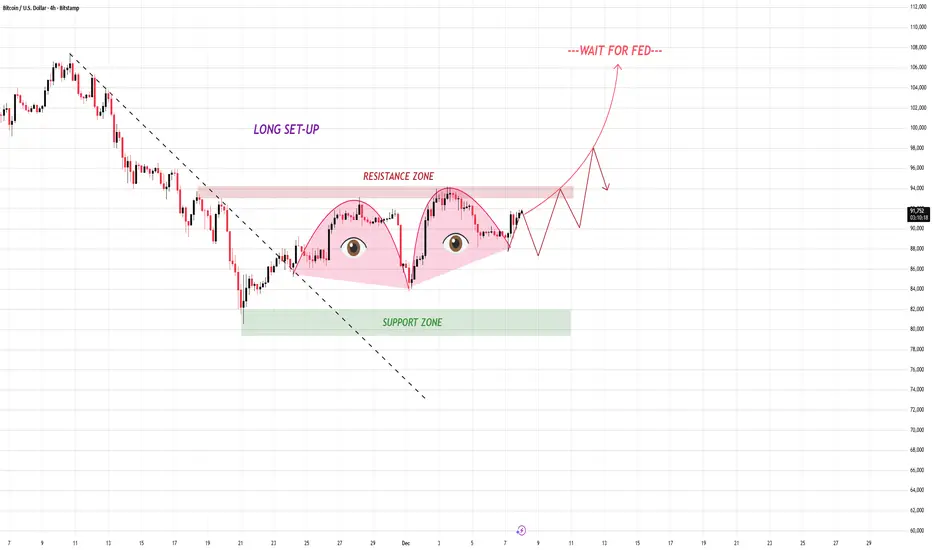
📌 TECHNICAL BREAKDOWN
1. Support Zone
Buyers consistently defend this area.
Each dip into this zone creates higher momentum on the rebound.
Strong liquidity pool — ideal for building long positions.
2. Resistance Zone (Neckline Zone)
Acts as the confirmation level for the double-bottom pattern.
Break and retest will be the key signal for a continuation run.
This zone contains trapped sellers → breakout may cause a squeeze.
3. Double-Bottom Formation
A textbook reversal pattern indicating exhaustion of the previous downtrend.
Both bottoms show clear absorption and equal reaction.
4. FED Event Catalyst
The “WAIT FOR FED” note on the chart marks a possible volatility spike.
Price may show fakeouts around resistance before choosing a direction.
A manipulation wick above the resistance is possible → be patient and let the market confirm.
📌 TRADE SETUP (LONG BIAS)
🔔 ENTRY ZONE:
Break & Retest of Resistance Zone
→ Enter after price closes above resistance and retests it successfully.
🛑 STOP LOSS:
Below the retest low
→ This protects you from FED-driven fakeouts.
🎯 TAKE PROFIT TARGETS:
TP1: First liquidity sweep after breakout
TP2: New short-term high
TP3: Extended target toward the projected upward curve
📌 BULLISH SCENARIO
- Break resistance
- Retest
- Build higher-lows
- Push into expansion phase
- FED catalyst accelerates breakout
This is the cleanest path and aligns with the chart’s projection.
📌 BEARISH SCENARIO (ALTERNATIVE)
If price fails to break resistance and rejects strongly:
- It may revisit the support zone again
- But as long as support holds, bias remains long
- Only a breakdown below support invalidates the setup
You don’t need to catch every move — you only need to catch the right one with discipline.
Trade attivo
Bitcoin Outlook: Breakout Pullback Scenario + Strong Bullish Case
BTC continues to respect its breakout structure, moving cleanly within the key support–resistance range. After the recent breakout attempt, momentum shows signs of cooling, which often signals a retracement into support before the next leg.
📉 Scenario 1 – Pullback Before Continuation (Most Probable in the Short Term)
BTC may dip back into the support zone to grab liquidity after the failed breakout.
This is typical behavior:
Breakout → liquidity sweep → retest → continuation.
As long as support holds, the structure remains healthy.
📈 Scenario 2 – Strong Bullish Breakout (High-Volatility Upside Case)
If BTC holds above the immediate support and buyers step in aggressively, we could see a clean bullish expansion, driven by:
Strong demand near key liquidity levels
Short squeezes from traders positioned against the breakout
Macro market stabilization favoring risk assets
In this case, BTC could push directly through resistance without a deep retracement — a signature of strong trend continuation.
Trade chiuso: obiettivo raggiunto
🔹 Market Structure: Consolidation Before Expansion
BTC remains in a clean range, sweeping liquidity on both edges a classic setup before a larger directional move.
Price is holding above demand zones and defending higher-timeframe support, showing that buyers are quietly accumulating, not exiting.
This type of controlled sideways movement often precedes a bullish breakout, especially when the macro environment aligns.
🔹 Macro Factors Now Supporting a Bullish Scenario
1. Fed Becoming More Dovish
Recent comments and data have strengthened expectations for earlier rate cuts.
Lower interest rates → weaker USD → increased capital inflow to risk assets like BTC.
This alone increases the probability of a medium-term bullish push.
2. Liquidity Returning to Global Markets
Equity indexes and high-beta assets are showing capital rotation as investors position ahead of 2025 monetary easing.
Bitcoin typically benefits strongly during liquidity expansion cycles.
3. ETF Demand Remains Structurally Strong
Spot BTC ETFs continue to absorb supply during dips, preventing deeper corrections and creating a steady bullish base.
4. Geopolitical Uncertainty → Hedge Demand
Periodic spikes in uncertainty have increased hedging flows into BTC as an alternative store of value.
This strengthens the floor during pullbacks.
🔹 What This Means for the Coming Sessions
BTC is likely to continue ranging in the short term, building liquidity before making a decisive move.
However, the probabilities now favor an upside breakout, supported both by structure and macro conditions.
Once BTC clears the upper boundary of the current range with volume, the next bullish leg becomes highly plausible.
MY COMMUNITY GROUP GET FREE SIGNAL
✅ 100% Free — I don’t take a penny from anyone
✅ Free Signal: 4 - 6 signals
✅ Trading Idea / Setup / Technical
✅ JOIN MY COMMUNITY GROUP IN Telegram:
t.me/+vxDQ4bhDfsw3MGU1
✅ 100% Free — I don’t take a penny from anyone
✅ Free Signal: 4 - 6 signals
✅ Trading Idea / Setup / Technical
✅ JOIN MY COMMUNITY GROUP IN Telegram:
t.me/+vxDQ4bhDfsw3MGU1
Pubblicazioni correlate
Declinazione di responsabilità
Le informazioni e le pubblicazioni non sono intese come, e non costituiscono, consulenza o raccomandazioni finanziarie, di investimento, di trading o di altro tipo fornite o approvate da TradingView. Per ulteriori informazioni, consultare i Termini di utilizzo.