Intro
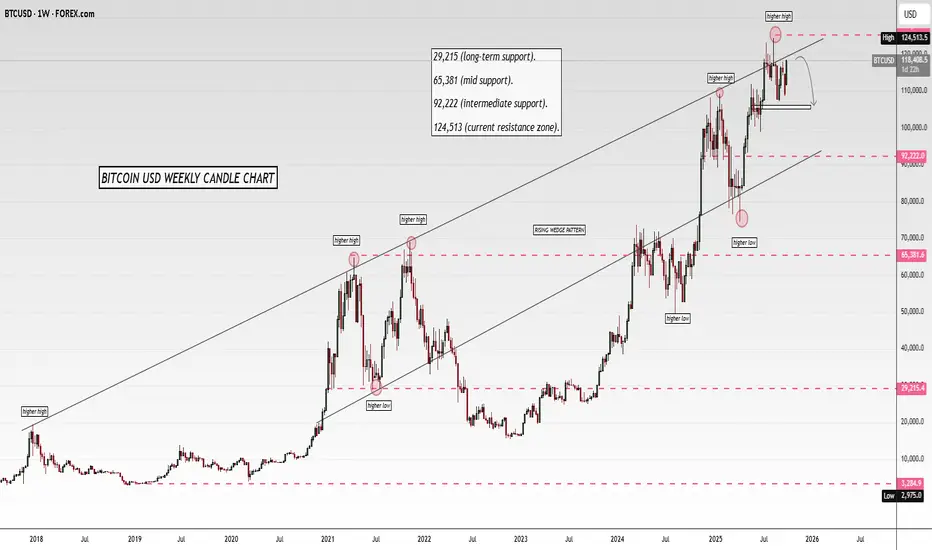
Bitcoin continues to respect its long-term ascending channel, currently trading near major resistance.
Chart Explanation
Price is approaching the upper resistance zone around 124,500, while holding higher lows from the 92,000 and 65,000 support regions. Structure suggests either a breakout continuation or a correction before retesting lower support levels.
📍 Entry Zone: 117,500 – 118,000
❌ Stop Loss: 124,800
🎯 Target 1: 112,000
🎯 Target 2: 92,500
Invalidation → If price breaks and holds above 124,500, bullish continuation towards new highs becomes likely.
Educational Point
Higher timeframes provide clarity on long-term structure. Always align lower timeframe entries with weekly trend context.
Engagement Question
Do you see Bitcoin breaking above 124,500, or is a correction back to 92k more likely?
⚠️ Disclaimer: This analysis is for educational purposes only. Not financial advice
📊 Forex & Gold Education & Analysis:
t.me/peakalphafx
t.me/peakalphafx
Declinazione di responsabilità
Le informazioni ed i contenuti pubblicati non costituiscono in alcun modo una sollecitazione ad investire o ad operare nei mercati finanziari. Non sono inoltre fornite o supportate da TradingView. Maggiori dettagli nelle Condizioni d'uso.