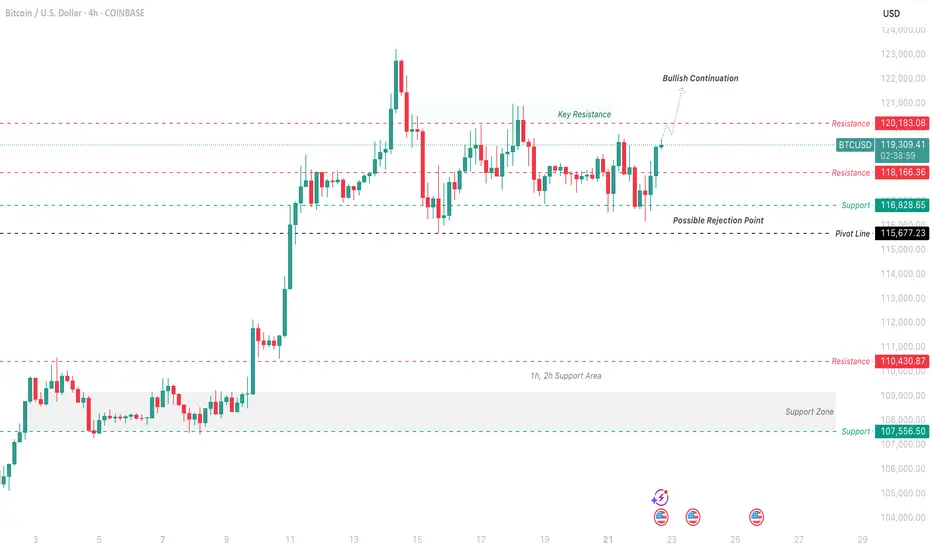
This analysis focuses on the Bitcoin/US Dollar 4-hour chart from Coinbase, highlighting a potential bullish continuation based on recent price action as of July 22, 2025. The chart shows a strong upward trend with a recent pullback, suggesting a possible rejection point near the pivot line at $115,672.23.
Putting myself in the reader’s shoes, I’d want to understand the key levels driving this prediction. The 1-hour and 2-hour support area around $107,656.23 has held firm, providing a solid base. The price recently approached the key resistance at $120,183.08, where it faced rejection, indicating a potential ceiling. If the price breaks above this resistance with strong volume, it could signal a continuation toward $123,000.00 or higher.
My thought process involves identifying the pivot point ($115,672.23) as a critical level. A bounce from this level, supported by the 1h/2h support zone, suggests bullish momentum. However, if the price fails to hold above $115,672.23 and drops below $107,656.23, it could invalidate this outlook, pointing to a deeper correction.
Profit Targets:
Short-term: $120,183.08 (key resistance)
Long-term: $123,000.00 (bullish continuation)
Stop Loss: $107,656.23 (below the 1h/2h support area)
These clearly defined targets and stop loss levels should help clarify the trade idea and manage risk effectively.
Declinazione di responsabilità
Le informazioni ed i contenuti pubblicati non costituiscono in alcun modo una sollecitazione ad investire o ad operare nei mercati finanziari. Non sono inoltre fornite o supportate da TradingView. Maggiori dettagli nelle Condizioni d'uso.
Declinazione di responsabilità
Le informazioni ed i contenuti pubblicati non costituiscono in alcun modo una sollecitazione ad investire o ad operare nei mercati finanziari. Non sono inoltre fornite o supportate da TradingView. Maggiori dettagli nelle Condizioni d'uso.