Let’s analyze your **BTCUSD H1 chart** carefully 👇
---
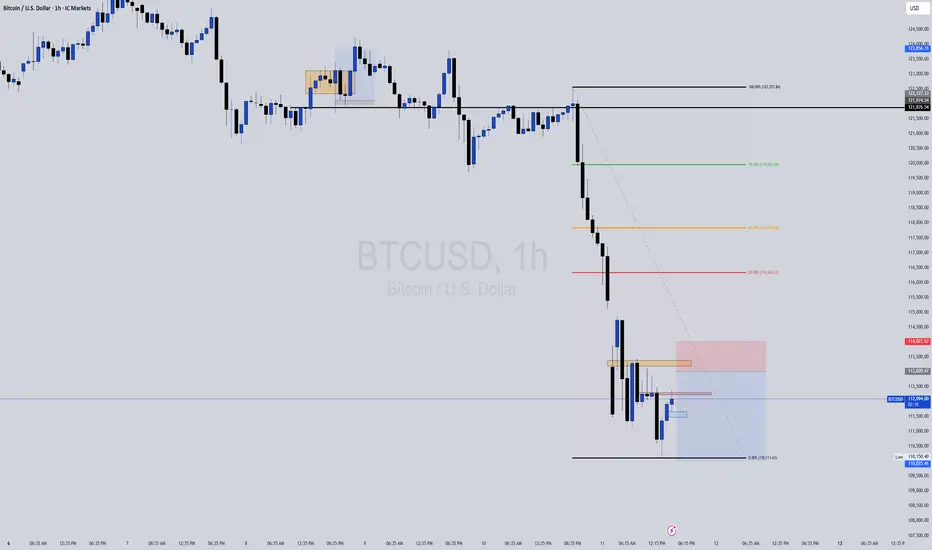
🧠 Chart Summary
* **Symbol:** BTCUSD
* **Timeframe:** H1
* **Current Price:** ~112,309
* **Sell Limit:** 113,041.61
* **Stop Loss (SL):** just above 113,041.61 (roughly near 113,300–113,400)
* **Take Profit (TP):** not explicitly shown but likely near 109,000–108,000 based on structure.
---
📊 **Technical Breakdown**
1️⃣ Trend Direction
* The pair is **in a clear short-term downtrend** after failing to hold above the **Previous Daily High (≈122,900)**.
* Price broke **below 50% and 61.8% Fibonacci retracement levels**, confirming bearish momentum.
* **Moving averages (Red = short-term EMA, Yellow = long-term EMA)** are both sloping **downward**, showing strong bearish momentum.
2️⃣ Key Structure Levels
* **Previous Daily High:** ~122,900 (Major resistance zone)
* **Previous Daily Low:** ~114,700 (Broken → retest expected)
* **Sell Limit Level (113,041.61):** Perfectly placed near the **Fibonacci 23.6%–38.2% retracement zone** of the last swing leg.
* This is an **ideal “lower-high” retracement entry** in a downtrend.
#### 3️⃣ Support Zones Below
Immediate support:** 111,800
Next key support:** 109,250 (around your possible TP zone)
Weekly low zone:** 108,350 – if that breaks, we could see a deeper push to 106,000.
---
⚙️ **Trade Plan Analysis (Sell Limit 113041.61)
| Aspect | Analysis |
| --------------------- | --------------------------------------------------------------- |
| **Setup Type** | Pullback Sell / Lower-High Entry |
| **Bias** | Strongly Bearish |
| **Entry Level** | 113,041.61 (Good retracement zone) |
| **Stop Loss** | Above 113,400–113,600 (just beyond structure) |
| **Take Profit** | 109,200–108,300 (previous support and 100% Fibonacci extension) |
| **Risk/Reward Ratio** | ~1:3 or better depending on TP placement |
| **Probability** | High – provided retracement completes to your Sell Limit |
---
🔥Confirmation Points Before Entry Triggers
If price retraces upward:
* Watch for **bearish engulfing** or **rejection candle** near 113,000 zone.
* If price fails to break above 113,400, your entry is valid.
* If it closes **above 113,600 on H1**, consider canceling the order — it would mean short-term momentum shifted bullish temporarily.
---
🧩 Summary Plan
✅ **Entry:** Sell limit at 113,041.61
✅ **SL:** 113,400–113,600
✅ **TP1:** 111,900
✅ **TP2:** 109,200
✅ **TP3:** 108,350
📉 **Bias:** Bearish continuation after pullback
---
⚠️Extra Notes
* Momentum is strong; if the retracement doesn’t reach 113,000, you might miss the entry — don’t chase.
* A secondary entry could form near **112,700** if a fresh rejection candle appears there.
* News events or BTC volatility spikes can create fake pullbacks — always watch the **H1 close** for confirmation.
-
---
🧠 Chart Summary
* **Symbol:** BTCUSD
* **Timeframe:** H1
* **Current Price:** ~112,309
* **Sell Limit:** 113,041.61
* **Stop Loss (SL):** just above 113,041.61 (roughly near 113,300–113,400)
* **Take Profit (TP):** not explicitly shown but likely near 109,000–108,000 based on structure.
---
📊 **Technical Breakdown**
1️⃣ Trend Direction
* The pair is **in a clear short-term downtrend** after failing to hold above the **Previous Daily High (≈122,900)**.
* Price broke **below 50% and 61.8% Fibonacci retracement levels**, confirming bearish momentum.
* **Moving averages (Red = short-term EMA, Yellow = long-term EMA)** are both sloping **downward**, showing strong bearish momentum.
2️⃣ Key Structure Levels
* **Previous Daily High:** ~122,900 (Major resistance zone)
* **Previous Daily Low:** ~114,700 (Broken → retest expected)
* **Sell Limit Level (113,041.61):** Perfectly placed near the **Fibonacci 23.6%–38.2% retracement zone** of the last swing leg.
* This is an **ideal “lower-high” retracement entry** in a downtrend.
#### 3️⃣ Support Zones Below
Immediate support:** 111,800
Next key support:** 109,250 (around your possible TP zone)
Weekly low zone:** 108,350 – if that breaks, we could see a deeper push to 106,000.
---
⚙️ **Trade Plan Analysis (Sell Limit 113041.61)
| Aspect | Analysis |
| --------------------- | --------------------------------------------------------------- |
| **Setup Type** | Pullback Sell / Lower-High Entry |
| **Bias** | Strongly Bearish |
| **Entry Level** | 113,041.61 (Good retracement zone) |
| **Stop Loss** | Above 113,400–113,600 (just beyond structure) |
| **Take Profit** | 109,200–108,300 (previous support and 100% Fibonacci extension) |
| **Risk/Reward Ratio** | ~1:3 or better depending on TP placement |
| **Probability** | High – provided retracement completes to your Sell Limit |
---
🔥Confirmation Points Before Entry Triggers
If price retraces upward:
* Watch for **bearish engulfing** or **rejection candle** near 113,000 zone.
* If price fails to break above 113,400, your entry is valid.
* If it closes **above 113,600 on H1**, consider canceling the order — it would mean short-term momentum shifted bullish temporarily.
---
🧩 Summary Plan
✅ **Entry:** Sell limit at 113,041.61
✅ **SL:** 113,400–113,600
✅ **TP1:** 111,900
✅ **TP2:** 109,200
✅ **TP3:** 108,350
📉 **Bias:** Bearish continuation after pullback
---
⚠️Extra Notes
* Momentum is strong; if the retracement doesn’t reach 113,000, you might miss the entry — don’t chase.
* A secondary entry could form near **112,700** if a fresh rejection candle appears there.
* News events or BTC volatility spikes can create fake pullbacks — always watch the **H1 close** for confirmation.
-
Declinazione di responsabilità
Le informazioni ed i contenuti pubblicati non costituiscono in alcun modo una sollecitazione ad investire o ad operare nei mercati finanziari. Non sono inoltre fornite o supportate da TradingView. Maggiori dettagli nelle Condizioni d'uso.
Declinazione di responsabilità
Le informazioni ed i contenuti pubblicati non costituiscono in alcun modo una sollecitazione ad investire o ad operare nei mercati finanziari. Non sono inoltre fornite o supportate da TradingView. Maggiori dettagli nelle Condizioni d'uso.