Why Bitcoin Might Have Reached Its Four-Year Cycle Top
Elliott Wave Count Analysis
Bullish Posture and Key Levels
- Historical Pattern: Bitcoin's four-year cycle often peaks around halving events, influencing supply and price dynamics.
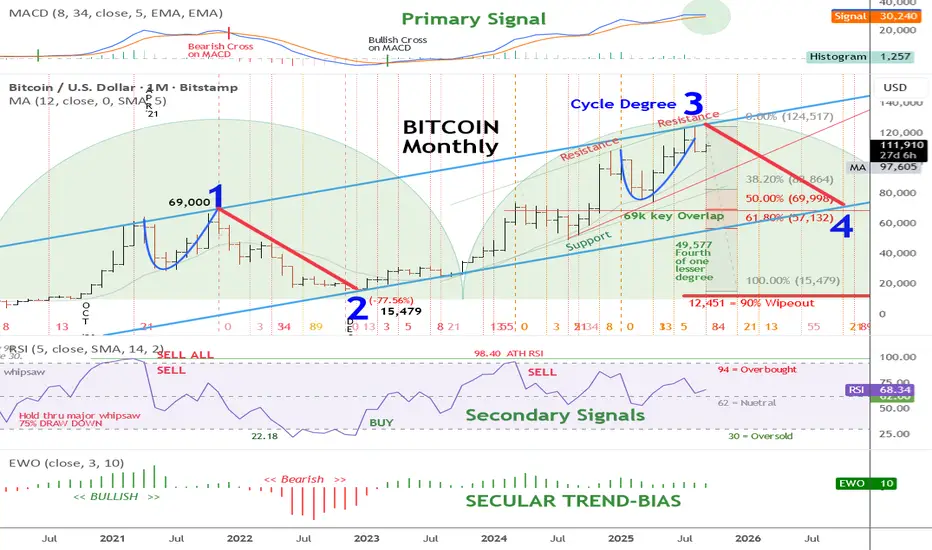
- MACD Signal: The primary signal indicator in the upper panel remains in a bullish position, with no bearish cross, indicating ongoing upward momentum.
- Wave 3 Peak: The current print high of 125,417 USD marks the crest of Cycle Degree 3, the strongest wave in an impulse sequence.
Elliott Wave Count Analysis
- Current Position: The chart labels the all-time print high of the Cycle Degree 3 high at 125,417.
- Wave 4 Expectation: A corrective wave 4 decline is anticipated, but it must remain above the wave one high of 69,000 USD to uphold the Elliott Wave structure.
- Wave 5 Potential: If wave 4 holds above 69,000 USD, a subsequent wave 5 could drive prices far higher, completing a larger Super Cycle degree wave I.
Bullish Posture and Key Levels
- Primary Signal Indicator: The long-term bullish posture based on the MACD remains intact, with the indicator staying bullish until a monthly close shows the fast-moving average crossing and closing below the slow-moving average.
- Support Level: Maintaining above 69,000 USD during any wave 4 pullback is crucial for the long-term bullish posture to persist and conform with the current wave count analysis.
Declinazione di responsabilità
Le informazioni e le pubblicazioni non sono intese come, e non costituiscono, consulenza o raccomandazioni finanziarie, di investimento, di trading o di altro tipo fornite o approvate da TradingView. Per ulteriori informazioni, consultare i Termini di utilizzo.
Declinazione di responsabilità
Le informazioni e le pubblicazioni non sono intese come, e non costituiscono, consulenza o raccomandazioni finanziarie, di investimento, di trading o di altro tipo fornite o approvate da TradingView. Per ulteriori informazioni, consultare i Termini di utilizzo.