See my previous charts and scenario predictions:
Yes! :o and wow!

Nopes!

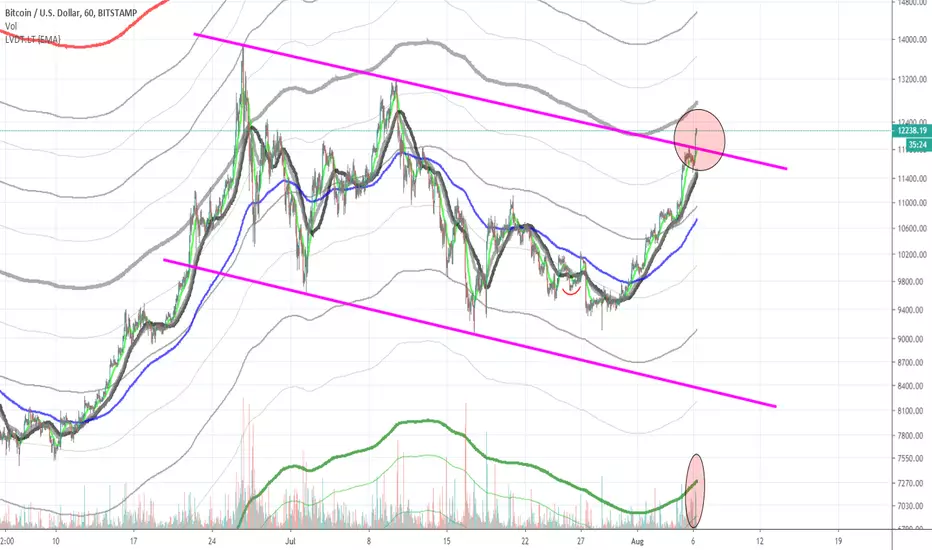
Zoom-in to see current price action in this chart! This is crazy!
I believe it probably will come down to retest 200 sma -- But will it?

Yes! :o and wow!
Nopes!
Zoom-in to see current price action in this chart! This is crazy!
I believe it probably will come down to retest 200 sma -- But will it?
Nota
Yes it did come down for the retest as predicted! The price needs to find support above the 200 ema, as the ema continues to head on forward in its current positive slope. If it goes below, then it will be signal for a continuation of the descending channel.
It will be useful to monitor the FUSIONGAPS and the MAJESTIC oscillators from here on out, to look at weather if the momentum is being sustained, or accelerating/decelerating.
Note: Typo above, it should be “ema” as well.
Declinazione di responsabilità
The information and publications are not meant to be, and do not constitute, financial, investment, trading, or other types of advice or recommendations supplied or endorsed by TradingView. Read more in the Terms of Use.
Declinazione di responsabilità
The information and publications are not meant to be, and do not constitute, financial, investment, trading, or other types of advice or recommendations supplied or endorsed by TradingView. Read more in the Terms of Use.