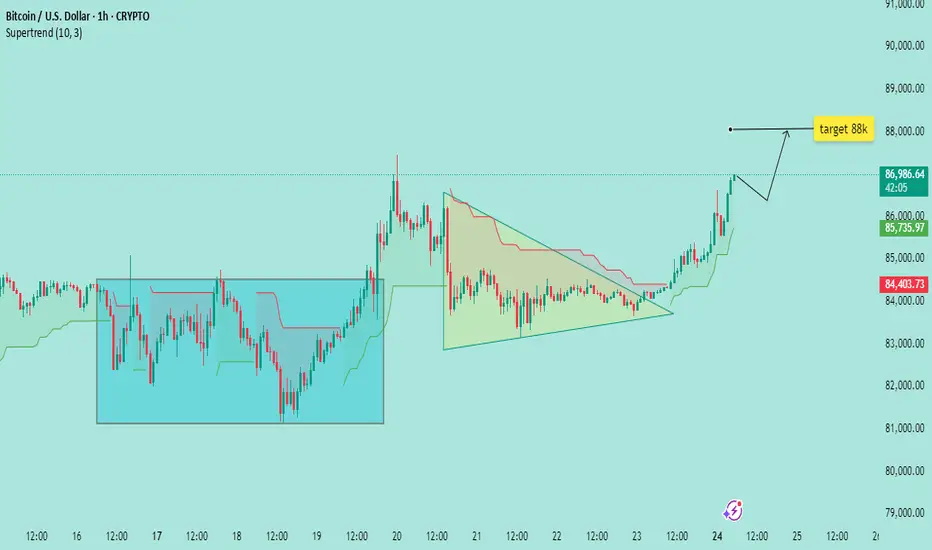
This 1-hour Bitcoin (BTC/USD) chart from TradingView highlights a breakout from a consolidation phase and a bullish pennant formation, signaling a strong upward move. The price has surged past the $86,900 level, with the next target set at $88,000. The Supertrend indicator (10,3) is supporting the bullish bias, while previous resistance levels have turned into potential support. If momentum continues, BTC could test new highs in the short term. Traders should watch for confirmation of the breakout and potential retracements before further gains.
Note: This is not a trading signal, just my personal analysis based on current market trends.
Note: This is not a trading signal, just my personal analysis based on current market trends.
Trade attivo
wow target is near to hit Trade chiuso: obiettivo raggiunto
CONGRATES TARGET HIT SuccessfullyPubblicazioni correlate
Declinazione di responsabilità
Le informazioni ed i contenuti pubblicati non costituiscono in alcun modo una sollecitazione ad investire o ad operare nei mercati finanziari. Non sono inoltre fornite o supportate da TradingView. Maggiori dettagli nelle Condizioni d'uso.
Pubblicazioni correlate
Declinazione di responsabilità
Le informazioni ed i contenuti pubblicati non costituiscono in alcun modo una sollecitazione ad investire o ad operare nei mercati finanziari. Non sono inoltre fornite o supportate da TradingView. Maggiori dettagli nelle Condizioni d'uso.