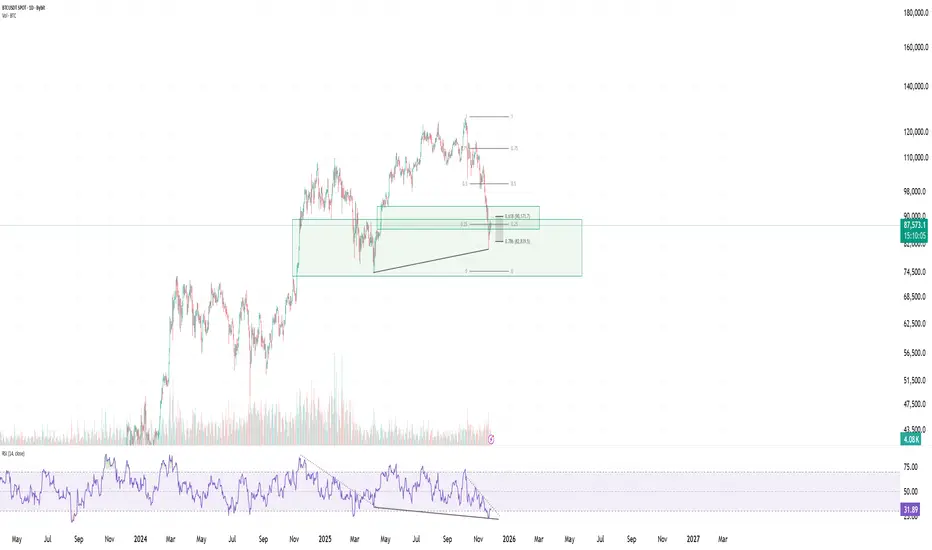
BTC has now reached a major extreme discount zone, completing a deep retracement into one of the strongest demand regions on the chart. This level aligns perfectly with key Fibonacci supports, making it a high-value area from a technical perspective.
Price has tapped the 0.618 – 0.786 Fibonacci cluster, which historically provides strong reactions during corrective phases. Combined with a clearly defined demand block, this forms a confluence that often marks the end of a corrective leg rather than the beginning of a deeper breakdown.
At the same time, the RSI is showing a hidden bullish divergence, where price makes a higher low while RSI makes a lower low. This pattern typically appears during continuation setups and suggests that underlying bullish strength may be returning despite the aggressive downside move.
These elements together create a scenario where the market is positioned in a high-probability reaction zone. As long as BTC holds above the key demand structure, the technicals support the idea of an upward continuation forming from here.
Key Technical Highlights:
• Strong confluence between the 0.618 – 0.786 Fibs
• Price is inside a major discount demand zone
• RSI showing hidden bullish divergence (continuation signal)
• Structure still supportive of an upside bounce as long as demand holds
• Market conditions resemble previous early-reversal zones
In simple terms: BTC is sitting inside a major discount area, touching the strongest Fibonacci supports, and RSI is flashing a hidden bullish signal. If this zone holds, it may mark the beginning of a recovery phase.
Market Structure • Price Action • Crypto Updates
🔗 Telegram: t.me/Coach
🔗 Telegram: t.me/Coach
Declinazione di responsabilità
Le informazioni e le pubblicazioni non sono intese come, e non costituiscono, consulenza o raccomandazioni finanziarie, di investimento, di trading o di altro tipo fornite o approvate da TradingView. Per ulteriori informazioni, consultare i Termini di utilizzo.