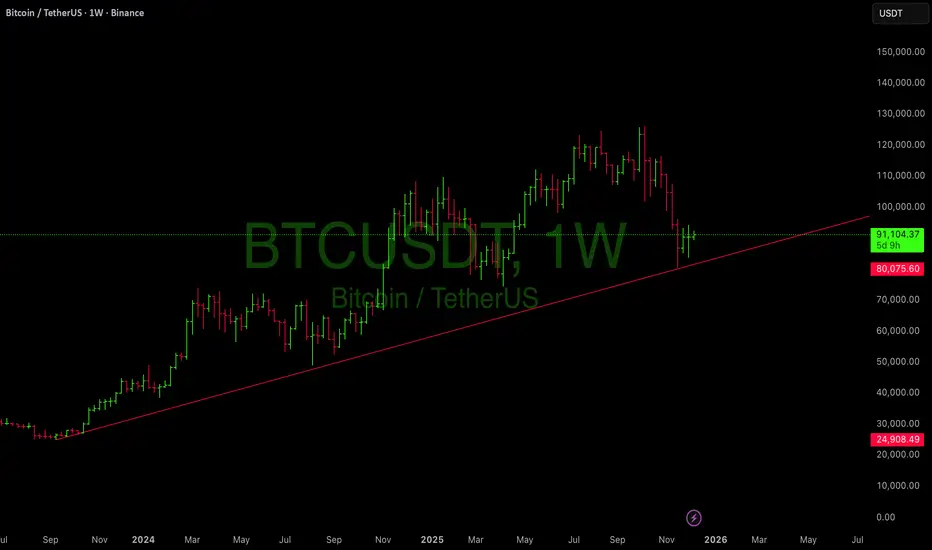
Bitcoin just completed a clean retest of its multi-year rising trendline, a structural level that has guided institutional accumulation since 2023. Price wicked below, tagged liquidity, and closed back above a classic bullish deviation → reclaim.
This type of structure historically marks the end of corrective phases and the beginning of new expansions.
📌 Key Bullish Factors
1. Long-Term Trendline Respect
Your chart shows a trendline starting from late 2023.
Price tapped it perfectly and is now holding above $80,000–$82,000, confirming:
Buyers stepped in where they were supposed to
Smart money defended the bullish structure
Heavy liquidation likely cleared weak longs
2. Weekly Candle Structure Turning
The last 2–3 weekly candles show:
Downward momentum slowing
Smaller bodies
Long wicks → buying from lower levels
A potential swing low forming at the trendline
Bitcoin is showing the early signs of seller exhaustion you typically see before a weekly reversal.
---
👉 The move tends to trap sellers before a strong leg up.
---
📈 Upside Targets (Weekly)
If BTC continues holding above trendline:
1. $98,000 – $102,000
→ First major liquidity pocket / inefficiency
2. $112,000 – $120,000
→ Prior breakdown zone + weekly imbalance
3. $135,000 – $150,000
→ Trend extension target / potential new ATH expansion
These are not promises they are structural destinations based on the weekly map.
---
## **🔻 Downside Invalidation**
The bullish thesis remains valid as long as Bitcoin doesn’t close a weekly candle below $80,000.
Break + close below would open deeper retracement into mid-70Ks.
But right now? The trendline holds strong.
---
🧠 Holistic Trader Insight
Institutional players accumulate on weakness, not strength.
When retail panics, smart money buys structure.
This entire move fits the textbook rules:
Trend intact
Liquidity swept
Structural level reclaimed
Momentum slowing into support
This is what early expansion phases look like.
Declinazione di responsabilità
Le informazioni e le pubblicazioni non sono intese come, e non costituiscono, consulenza o raccomandazioni finanziarie, di investimento, di trading o di altro tipo fornite o approvate da TradingView. Per ulteriori informazioni, consultare i Termini di utilizzo.
Declinazione di responsabilità
Le informazioni e le pubblicazioni non sono intese come, e non costituiscono, consulenza o raccomandazioni finanziarie, di investimento, di trading o di altro tipo fornite o approvate da TradingView. Per ulteriori informazioni, consultare i Termini di utilizzo.