1-Hour Technical Snapshot
Key Levels
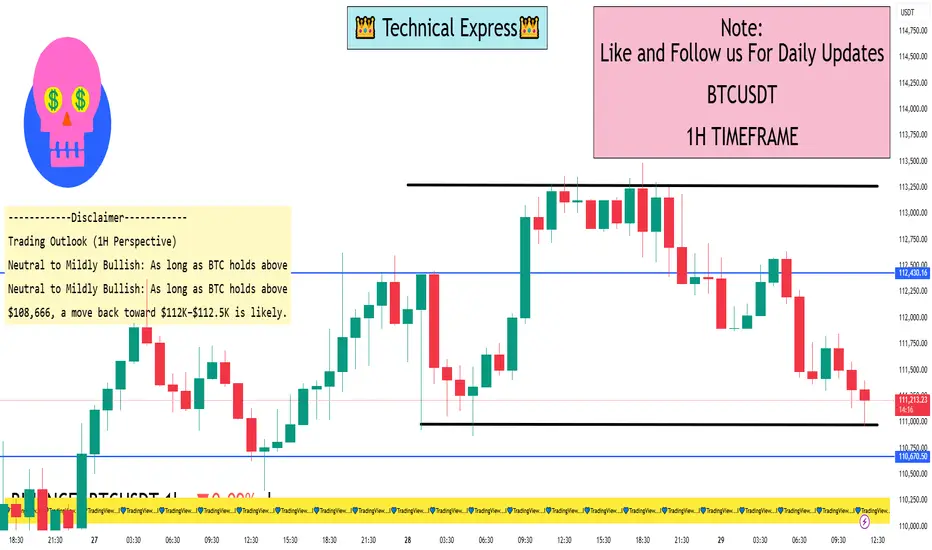
Support Zones:
~$110,000–$110,600 — viewed as a critical short-term support / demand area. It’s where BTC could stabilize if the current slide continues
~$108,666 — a deeper support level; a break below this risks a pullback toward $101,000, near the 200-day moving average
Resistance Zones:
~$112,000–$112,500 — a key resistance or supply area, with potential selling pressure around this range
~$124,474 — the recent monthly closing high and psychologically significant level; clearing this would be a strong bullish confirmation
Market Sentiment & Setup
Bullish Case: BTC sitting near $111,600 is seen by some analysts as a potential entry zone for a bullish continuation pattern (like a bull flag). A break above $115,544 (20-day SMA) could fuel a push toward $125,000
Bearish Risk: If $108,666 support fails, the risk is for a deeper drop toward $101,000, negating the bullish setup
Other indicator-based technical analysis tools (like TradingView’s technical summary) reflect a neutral bias on 1H charts, while longer-term timeframes lean more bullish
Key Levels
Support Zones:
~$110,000–$110,600 — viewed as a critical short-term support / demand area. It’s where BTC could stabilize if the current slide continues
~$108,666 — a deeper support level; a break below this risks a pullback toward $101,000, near the 200-day moving average
Resistance Zones:
~$112,000–$112,500 — a key resistance or supply area, with potential selling pressure around this range
~$124,474 — the recent monthly closing high and psychologically significant level; clearing this would be a strong bullish confirmation
Market Sentiment & Setup
Bullish Case: BTC sitting near $111,600 is seen by some analysts as a potential entry zone for a bullish continuation pattern (like a bull flag). A break above $115,544 (20-day SMA) could fuel a push toward $125,000
Bearish Risk: If $108,666 support fails, the risk is for a deeper drop toward $101,000, negating the bullish setup
Other indicator-based technical analysis tools (like TradingView’s technical summary) reflect a neutral bias on 1H charts, while longer-term timeframes lean more bullish
I built a Buy & Sell Signal Indicator with 85% accuracy.
📈 Get access via DM or
WhatsApp: wa.link/d997q0
Contact - +91 76782 40962
| Email: techncialexpress@gmail.com
| Script Coder | Trader | Investor | From India
📈 Get access via DM or
WhatsApp: wa.link/d997q0
Contact - +91 76782 40962
| Email: techncialexpress@gmail.com
| Script Coder | Trader | Investor | From India
Pubblicazioni correlate
Declinazione di responsabilità
Le informazioni e le pubblicazioni non sono intese come, e non costituiscono, consulenza o raccomandazioni finanziarie, di investimento, di trading o di altro tipo fornite o approvate da TradingView. Per ulteriori informazioni, consultare i Termini di utilizzo.