Hello, traders!
Follow us to get the latest information quickly.
Have a great day.
-------------------------------------
(BTCUSDT 1W chart)
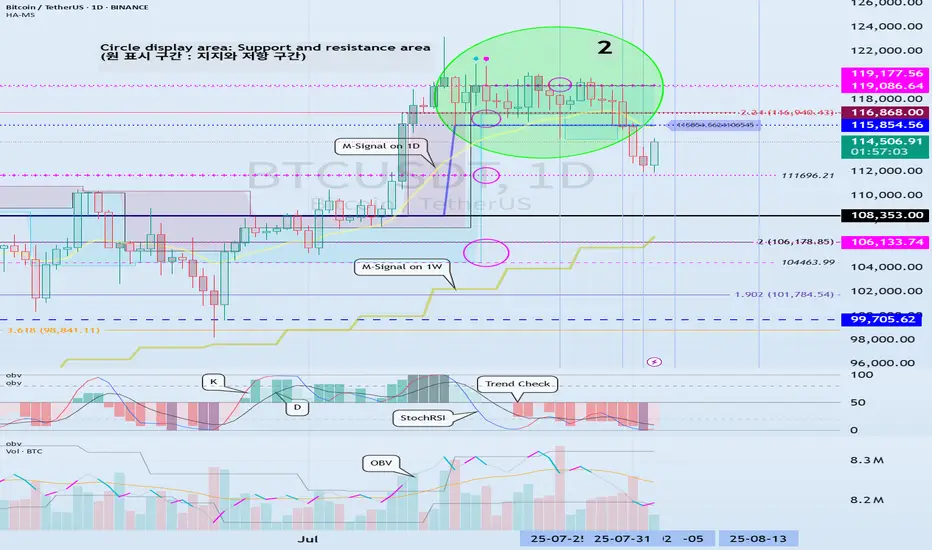
The key is whether it can rise above the newly created DOM (60) indicator point of 119086.64.
If this fails and the price declines, we need to check for support near the previous all-time high (ATH) of 108,353.0.
Since the M-Signal indicator on the 1W chart is rising near 108,353.0, this area is expected to serve as important support and resistance.
-
(1D chart)
This period of volatility is expected to continue until August 6th.
Therefore, the key question is whether the price can rise above 115,854.56 and maintain its upward momentum.
If not, further declines are likely.
-
To rise above 115,856.56,
- The StochRSI indicator must rise within the oversold zone and remain above K > D.
- The On-Bottom Volume indicator must continue its upward trend with OBV > OBVEMA. - The TC (Trend Check) indicator should maintain an upward trend. (If possible, it's best to rise above the 0 point.)
If the above conditions are met and the price rises above 115854.56, it is expected to attempt to rise above 119177.56.
This period of volatility is a significant period of volatility.
Therefore, if the price falls below the HA-High ~ DOM(60) range and encounters resistance during this period, you should prepare for further declines.
-
The basic trading strategy is to buy in the DOM(-60) ~ HA-Low range and sell in the HA-High ~ DOM(60) range.
However, if the price rises in the HA-High ~ DOM(60) range, a stepwise upward trend is likely, while a decline in the DOM(-60) ~ HA-Low range is likely to result in a stepwise downward trend.
Therefore, a split trading strategy is recommended as the basic trading strategy.
When executing a trade, appropriate profit taking secures the liquidity of your investment, giving you the opportunity to seize new opportunities.
To achieve this, you should consider your intended investment horizon before initiating the trade and divide the trade accordingly.
-
The HA-Low indicator on the 1D chart is currently at 89294.25.
Therefore, I believe the market believes it's in a position to take profit.
-
Thank you for reading to the end.
I wish you successful trading.
--------------------------------------------------
- This is an explanation of the big picture.
(3-year bull market, 1-year bear market pattern)

I will explain in more detail when the bear market begins.
------------------------------------------------------
Nota
#IBIT (Spot BTC ETF Chart)The 62.41-67.21 range represents a key support and resistance zone.
A gap exists between 65.65 and 66.68.
Therefore, the key question is whether the price can rise to and sustain around 67.21.
Currently, the HA-High ~ DOM (60) range is formed between 63.04 and 63.23, so if the price holds above that level, a step-up trend is expected.
※ Follow X to check out the posts.
※ X를 팔로우하고 게시물을 확인하세요.
◆ t.me/readCryptoChannel
[HA-MS Indicator]
bit.ly/3YxHgvN
[OBV Indicator]
bit.ly/4dcyny3
※ X를 팔로우하고 게시물을 확인하세요.
◆ t.me/readCryptoChannel
[HA-MS Indicator]
bit.ly/3YxHgvN
[OBV Indicator]
bit.ly/4dcyny3
Pubblicazioni correlate
Declinazione di responsabilità
Le informazioni ed i contenuti pubblicati non costituiscono in alcun modo una sollecitazione ad investire o ad operare nei mercati finanziari. Non sono inoltre fornite o supportate da TradingView. Maggiori dettagli nelle Condizioni d'uso.