📝 Description:
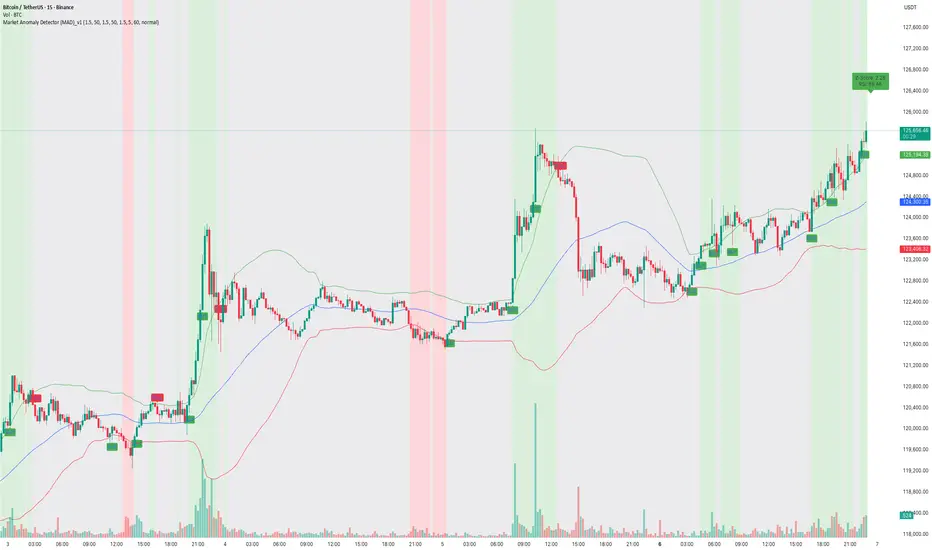
Watch how the Market Anomaly Detector (MAD) precisely captured the start of the Bitcoin breakout on the 15-minute chart — with no lag, early confirmation, and clear signals.
This BTC/USDT rally was flagged using:
• ✅ Z-Score Spike + RSI confirmation
• ✅ Volume Thrust + Trend Strength Filter
• ✅ Dynamic Zone Coloring for Visual Clarity
• ✅ Trade Cooldown Filter to avoid signal noise
💡 The green background highlights anomaly confirmation zones, while red indicates potential fakeouts or traps.
In this rally:
• The MAD indicator identified the compression breakout
• Maintained bullish zone with no false exit
• Generated a clean trend-following environment using adaptive logic.
🔍 Why MAD Works:
The MAD Indicator isn’t just about spotting anomalies — it adapts based on:
• Market volatility and relative volume
• Internal momentum using z-score logic
• Confirmation from RSI & EMAs
• A cooldown filter to prevent overtrading in choppy zones
📈 Perfect for scalpers, intraday traders, and short-term swing setups on crypto and stocks.
Thanks.
TradeTech Analysis
Telegram Channel - t.me/Tradetech2024
Youtube Channel - youtube.com/@TradeTechAnalysis
Website - tradetechanalysis.com/
Super Profile - superprofile.bio/tradetechanalysis
TradeTech Analysis
Telegram Channel - t.me/Tradetech2024
Youtube Channel - youtube.com/@TradeTechAnalysis
Website - tradetechanalysis.com/
Super Profile - superprofile.bio/tradetechanalysis
Declinazione di responsabilità
Le informazioni ed i contenuti pubblicati non costituiscono in alcun modo una sollecitazione ad investire o ad operare nei mercati finanziari. Non sono inoltre fornite o supportate da TradingView. Maggiori dettagli nelle Condizioni d'uso.