📉 BTCUSDT – Wave 5 Completed, Correction in Progress!
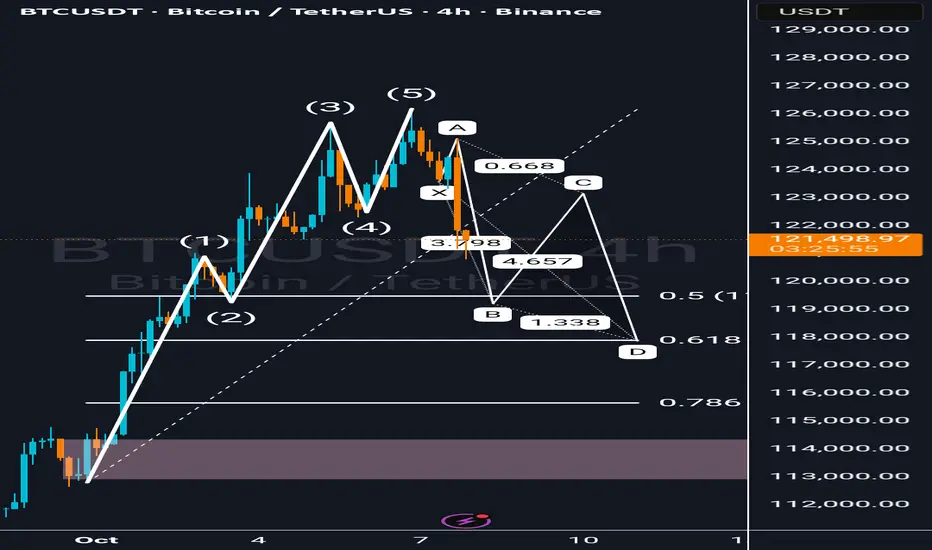
After completing a clear Elliott Wave impulse (1–5), Bitcoin now appears to be entering a complex corrective phase.
The chart shows an emerging ABC pattern that may align with a harmonic XA–BC–D structure, with key Fibonacci confluence zones around:
0.5 retracement: 119,484
0.618 retracement: 117,900
Potential Wave D target: 117K–118K
This correction could offer a buy-the-dip opportunity if BTC holds above the Fibonacci support and shows a strong bullish reaction.
However, if Wave D breaks below the 0.786 zone (around 115K), selling pressure could extend toward the 1.272 extension (around 109K).
📊 Short-term traders: Watch price reactions near 119K–118K.
📈 Long-term investors: Wait for a confirmed reversal signal before entering.
---
💬 What do you think? Is this just a healthy pullback before the next impulsive wave, or the start of a deeper correction?
#BTCUSDT #Bitcoin #ElliottWave #CryptoAnalysis #TradingView
Declinazione di responsabilità
Le informazioni ed i contenuti pubblicati non costituiscono in alcun modo una sollecitazione ad investire o ad operare nei mercati finanziari. Non sono inoltre fornite o supportate da TradingView. Maggiori dettagli nelle Condizioni d'uso.
Declinazione di responsabilità
Le informazioni ed i contenuti pubblicati non costituiscono in alcun modo una sollecitazione ad investire o ad operare nei mercati finanziari. Non sono inoltre fornite o supportate da TradingView. Maggiori dettagli nelle Condizioni d'uso.